
![]()
При посиланні на статтю з нашого журналу
необхідно вказувати:
- назву журналу
українською мовою - Медичні перспективи
або транслітерацією - Medicni perspektivi
- DOI статті
![]()


Key words: interpretive bias, smokers, smoker identity, contextual interventions, psychological interventions
Ключові слова: інтерпретаційне упередження, курці, ідентичність курця, контекстні втручання, психологічні втручання
Abstract
Smoking-related interpretive bias, a core aspect of cognitive distortion in addiction, remains poorly understood regarding its specific characteristics and underlying activation mechanisms. This study addressed this gap through three sub studies exploring the intrinsic properties of smokers’ interpretive bias, the role of smoker identity, and the moderating effect of cognitive load. The Ambiguous Scenario Test was employed to assess interpretive bias. Results revealed that smokers exhibited significantly higher levels of smoking related interpretive bias compared to nonsmokers. Furthermore, smokers with a strong smoker identity displayed more pronounced bias than those with a weak identity. Importantly, the predictive influence of smoker identity on this bias diminished as cognitive load increased, indicating that cognitive resources modulate the identity bias relationship. These findings suggest that sufficient cognitive capacity is necessary for smoker identity to effectively activate associated interpretive biases. By clarifying the core features of smoking-related interpretive bias, identifying smoker identity as a key contributor, and demonstrating cognitive load’s moderating role, this research advances theoretical understanding of cognitive bias components and triggering mechanisms in smokers. The results also hold practical implications for developing targeted interventions aimed at disrupting maladaptive cognitive processes in smoking behavior.
Реферат
Реконфігурація когнітивного упередження в курців: інтегрований підхід, що поєднує ідентичність і контекстуальні втручання. Ченг Тонгшун, Фероз Назія, Фарук Мухаммад Сабіль. Інтерпретаційне упередження, пов’язане з курінням, яке є ключовим аспектом когнітивних викривлень при залежності, залишається недостатньо вивченим з точки зору його специфічних характеристик і механізмів активації. Це дослідження заповнює зазначену прогалину шляхом проведення трьох піддосліджень, спрямованих на вивчення внутрішніх властивостей інтерпретаційного упередження в курців, ролі ідентичності курця та модераторного ефекту когнітивного навантаження. Для оцінювання інтерпретаційного упередження було використано тест неоднозначних сценаріїв (Ambiguous Scenario Test). Результати показали, що курці демонструють значно вищий рівень інтерпретаційного упередження, пов’язаного з курінням, порівняно з некурцями. Крім того, у курців з вираженою ідентичністю курця це упередження проявляється сильніше, ніж в осіб зі слабкою ідентичністю. Важливо зазначити, що прогностичний вплив ідентичності курця на вираженість цього упередження зменшувався зі зростанням когнітивного навантаження, що свідчить про роль когнітивних ресурсів у модерації зв’язку між ідентичністю та інтерпретаційним упередженням. Ці результати вказують на те, що для ефективної активації відповідних інтерпретаційних упереджень ідентичності курця необхідний достатній рівень когнітивних ресурсів. Уточнюючи ключові характеристики інтерпретаційного упередження, пов’язаного з курінням, визначаючи ідентичність курця як важливий чинник і демонструючи модераторну роль когнітивного навантаження, це дослідження розширює теоретичне розуміння компонентів когнітивних упереджень і механізмів їх активації в курців. Отримані результати також мають практичне значення для розроблення цільових втручань, спрямованих на переривання дезадаптивних когнітивних процесів, що лежать в основі поведінки куріння.
Reducing national smoking prevalence and modifying smokers’ behavior remain central goals of tobacco control policies in China. Previous research indicates that smokers often display cognitive biases when processing smoking-related cues, which reinforce smoking behavior and hinder quitting [40, 41]. These biases play a key role in addiction persistence and smoking cessation failure [8]. Cognitive biases include attentional, memory, and interpretive bias [25], but existing studies focus primarily on attentional bias [44], with limited attention to interpretive bias. Interpretive bias is the tendency to select a specific explanation for ambiguous information, reflecting a systematic preference [22]. Unlike attentional bias, it occurs later in cognitive processing and directly reflects how individuals assign meaning to situations [28], making it critical for understanding smokers’ cognitive processes. Research on interpretive bias in addiction has focused on alcohol use. Woud et al. (2012) developed a measure using ambiguous scenarios; heavy drinkers interpreted them more often in alcohol-related ways than light drinkers [42], a pattern confirmed in alcohol-dependent individuals [43]. Like alcohol addiction, smoking stems from physiological and psychological responses to substances, but smokers face more frequent cue exposure: they typically smoke 10-20 cigarettes daily [47] and often carry cigarettes. Thus, investigating smoking-related interpretive bias is vital. Hypothesis 1: Smokers show significantly higher smoking-related interpretive bias than nonsmokers. Theories explaining interpretive bias in addiction include Incentive Sensitization Theory (Robinson, Berridge) [34], Dual Process Model (Salemink, Wiers) [36], and Cognitive Mechanisms of Addiction [10], collectively suggesting smokers may exhibit biased processing of smoking cues. Addiction cues integrate with self-concept to form an addict identity (Frings, Albery) [16]; smoker identity is the degree to which individuals incorporate the smoker role into their self-concept [14]. Though unstudied directly, smoker identity influences smoking behaviors [3, 5, 6, 26], and identity shapes cognitive biases in other domains [1, 13, 21, 29, 39]. Hypothesis 2: Smokers with stronger smoker identity show higher smoking-related interpretive bias. Schema Theory (Beck, Haigh) [2] and the Self-Reference Effect [45, 46] suggest smoker identity guides interpretive processing. Cognitive load may moderate this relationship: high cognitive load reduces reflective processing resources [12, 23, 37]. Hypothesis 3: The effect of smoker identity on smoking-related interpretive bias weakens as cognitive load increases.
The purpose of this study is to examine the characteristics and mechanisms of smoking related interpretive bias among smokers. Specifically, the study investigates differences in interpretive bias between smokers and nonsmokers, examines the influence of smoker identity on interpretive bias, and explores the moderating role of cognitive load in this relationship. To achieve these objectives, three sub studies were conducted. Study 1 compared interpretive bias between smokers and nonsmokers. Study 2 manipulated smoker identity using a social identity salience paradigm to examine its influence on interpretive bias. Study 3 introduced a cognitive load manipulation using a digit memory task to investigate the moderating role of cognitive resources.
MATERIALS AND METHODS OF RESEARCH
Study 1: Characteristics of smokers’ smoking related interpretive bias
Sample size was calculated using G*Power 3.1.9.7 software, with an effect size of 0.25, α error probability of 0.05, and statistical power of 0.80, requiring a minimum of 34 participants. Participants were recruited through online social platforms such as WeChat, resulting in 40 smokers and 40 nonsmokers. Eligibility criteria for smokers were: 1) Daily smoking with a minimum of 5 cigarettes per day; 2) No major physical or mental illnesses, and no history of other substance addictions. After all participants completed the experiment, 5 invalid participants with a scenario judgment accuracy rate below 80% in the interpretive bias test were excluded, leaving 75 valid participants. Among them, there were 36 smokers (all male) and 39 nonsmokers (38 males, 1 female), with average ages of 23.61 years (SD=2.72) and 23.59 years (SD=2.67), respectively no significant difference was found (t (73)=0.03, p=0.973). For smokers, the average age of first smoking was 17.97 years (SD=2.35), average smoking duration was 5.62 years (SD=2.60), average daily smoking quantity was 11.36 cigarettes (SD=7.64), average nicotine dependence score was 3.08 (SD=2.25), and average smoking craving score was 3.71 (SD=1.73).
A 2 (Participant Type: Smoker, Nonsmoker) × 2 (Interpretation Target Sentence Type: Smoking related, smoking unrelated) mixed experimental design was used. Participant type was a between subjects’ variable, interpretation target sentence type was a within subject’s variable, and the dependent variable was interpretive bias.
(1) Measure of interpretive bias: Referring to the experimental materials used in a series of alcohol related interpretive bias studies by Woud et al. [42, 43], 24 smoking related ambiguous scenarios were compiled (each with 2 interpretation target sentences). Thirty postgraduate students majoring in psychology rated the scenarios on theme relevance, interpretive fluency, and valence, and provided revision suggestions, leading to the final selection of 9 ambiguous scenarios. Each scenario was paired with two interpretation target sentences: one smoking related and one smoking unrelated. For example, the scenario was: “You walk restlessly in the room. You are dissatisfied with the current situation you have a backlog of work, and now you’ve lost your wallet. You just want to forget all the…” The two interpretation target sentences were: “You want to forget all your troubles and decide to smoke a cigarette” and “You want to forget all your troubles and decide to go for a run.” Participants were asked to rate the degree of fit between the behavior described in each interpretation target sentence and the scenario (1=Very inconsistent, 4=Very consistent).
(2) Nicotine Dependence Scale: The Fagerström Test for Nicotine Dependence (Heatherton et al.) [20] was used. The scale consists of 6 items (e.g., “Over the past month, how many cigarettes have you smoked per day?”). Scores were converted and summed, with higher scores indicating greater nicotine dependence. The internal consistency coefficient (Cronbach’s α) of the scale in this study was 0.75.
(3) Smoking Craving Scale: The Brief Questionnaire of Smoking Urges (Cox et al.) [11] was used. The scale includes 10 items (e.g., “I really want to smoke a cigarette now”), rated on a 7 point scale (1=completely disagree, 7=completely agree). Higher scores indicate stronger smoking craving. The internal consistency coefficient (Cronbach’s α) of the scale in this study was 0.95.
(4) Self compiled demographic questionnaire: The questionnaire included gender, age, history of organic brain diseases and mental illnesses, and history of other substance addictions. Smokers were also asked to report their age of first smoking and average daily smoking quantity.
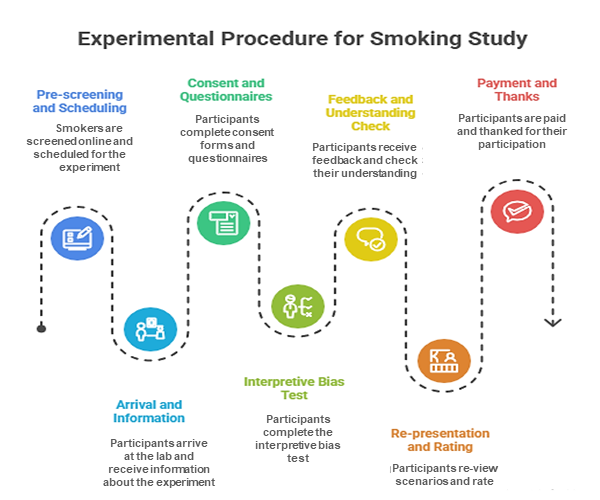
The overall experimental procedure was as follows: 1) One day before the experiment, smokers were prescreened online and scheduled for the experiment. To control pre experimental smoking craving, they were instructed not to smoke within 2 hours before the experiment [24, 48]. 2) Upon arriving at the laboratory, participants were informed of the experimental process and precautions. 3) Participants completed the informed consent form, demographic questionnaire, Nicotine Dependence Scale, and Smoking Craving Scale. 4) Both smoker and nonsmoker groups completed the same interpretive bias test. 5) After the experiment, participants were paid and thanked.
The interpretive bias test procedure referred to Woud et al. [43]. Participants completed 9 ambiguous scenario tasks. The procedure for each scenario is shown in Figure 1: 1) Presentation of the ambiguous scenario, with the last character of the final sentence omitted. 2) Participants were asked to fill in the missing character according to the context. 3) Feedback was provided: if correct, the complete character was displayed in green; if incorrect, a red error message appeared, prompting participants to retry. 4) After each scenario, a question asking whether participants understood the scenario’s meaning was presented, and participants responded “Correct” or “Incorrect.” 5) The ambiguous scenario and its two interpretation target sentences were presented again, and participants rated the fit between each target sentence and the scenario.
Statistical analysis was conducted using the Statistical Package for the Social Sciences software, version 26.0 (SPSS Inc., Chicago, IL, USA; license number Z12345678). Before the main analysis, data quality was assessed. Participants whose character completion accuracy rate was lower than 80 percent were excluded from further analysis to ensure data reliability. Quantitative data are presented as median and interquartile range. Qualitative variables are presented as frequencies and percentages where appropriate. The interpretive bias scores were calculated by averaging participants’ responses to the interpretation target sentences across nine ambiguous scenarios. Two scores were obtained for each participant, namely the smoking related interpretive bias score and the smoking unrelated interpretive bias score. To examine differences between groups and interpretation types, repeated measures analysis of variance was applied. Group membership served as the between subject factor, while interpretation type served as the within subject factor. Statistical procedures were performed according to established statistical methodology described in standard statistical literature (Field, 2018). The level of statistical significance was set at p<0.05. Reference for statistical methods: Field A. Discovering Statistics Using IBM SPSS Statistics. 5th ed. London: SAGE Publications; 2018.
The flowchart includes fixation point (1000 ms), scenario presentation (5000 ms), character filling (5000 ms), feedback (3000 ms), scenario judgment, and evaluation stages. Example scenario and target sentences are as described above.Fig. 1. Experimental procedure flowchart ↓
The research was conducted in accordance with the principles of bioethics set out in the WMA Declaration of Helsinki – “Ethical principles for medical research involving human participants” and “Universal Declaration on Bioethics and Human Rights” (UNESCO).
RESULTS AND DISCUSSION
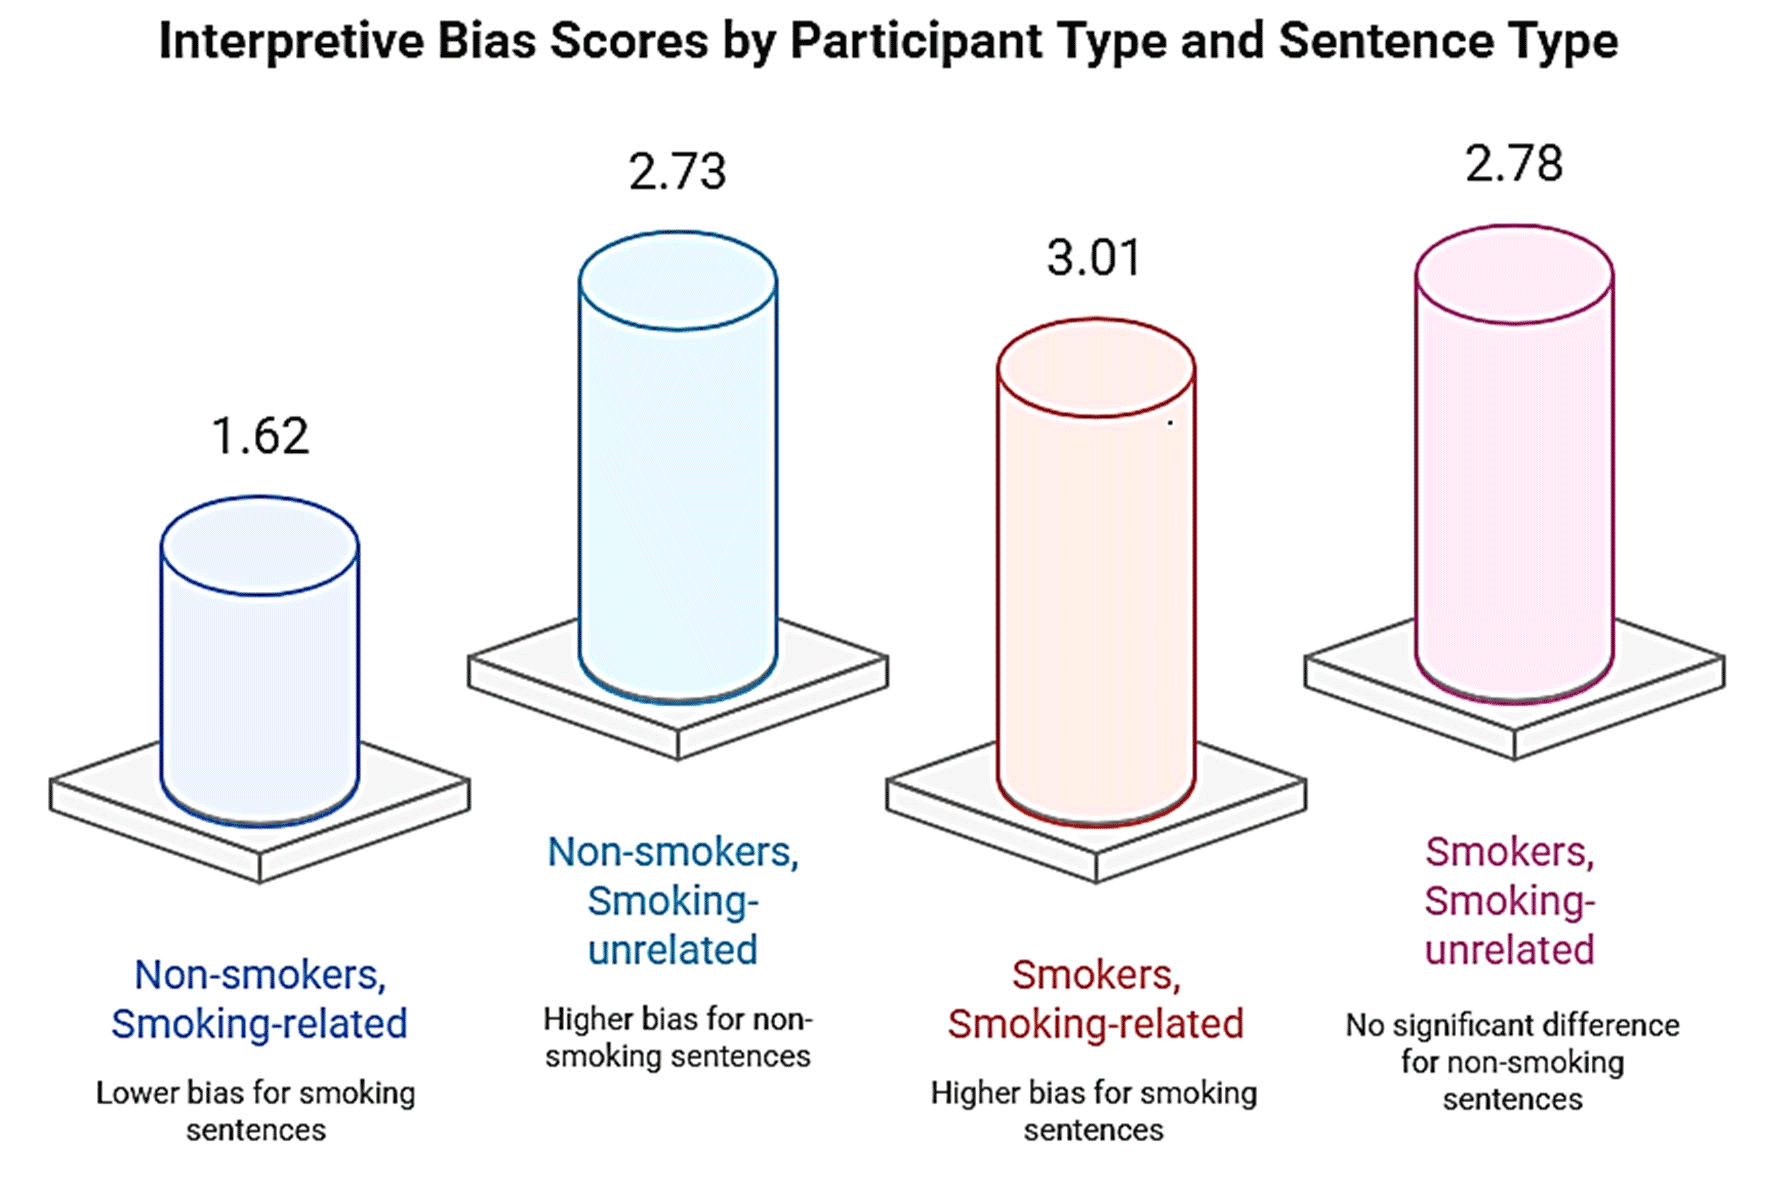
The smoking related and smoking unrelated interpretive bias scores of participants in Study 1 are shown in Figure 2. Repeated measures ANOVA on interpretive bias scores revealed a significant main effect of participant type (F (1,73)=88.00, p<0.001, partial η²=0.55), with nonsmokers showing significantly lower interpretive bias than smokers. A significant main effect of interpretation target sentence type was also found (F (1, 73)=58.15, p<0.001, partial η²=0.44), with participants exhibiting significantly higher interpretive bias for smoking unrelated sentences than smoking related sentences. The interaction between participant type and interpretation target sentence type was significant (F (1, 73)=133.61, p<0.001, partial η²=0.65).
Simple effects analysis showed that for smoking related sentences, smokers’ interpretive bias scores (M=3.01, SD=0.32) were significantly higher than those of nonsmokers (M=1.62, SD=0.55) (F (1, 73)=175.85, p<0.001, partial η²=0.71). For smoking unrelated sentences, there was no significant difference between smokers (M=2.78, SD=0.38) and nonsmokers (M=2.73, SD=0.38) (F (1, 73)=0.31, p=0.578). Additionally, for smokers, interpretive bias scores for smoking related sentences (M=3.01, SD=0.32) were significantly higher than those for smoking unrelated sentences (M=2.78, SD=0.38) (F (1, 73)=7.44, p=0.008, partial η²=0.09). For nonsmokers, interpretive bias scores for smoking related sentences (M=1.62, SD=0.50) were significantly lower than those for smoking unrelated sentences (M=2.73, SD=0.38) (F (1, 73)=191.69, p<0.001, partial η²=0.72).
* – p<0.05, *** – p<0.001: the same applies below.Fig. 2. Smoking related and smoking unrelated interpretive bias of participants in study 1 ↓
Study 2: The Effect of Smoker Identity on Smokers’ Interpretive Bias
Sample size was calculated using G*Power 3.1.9.7 software, with an effect size of 0.25, α error probability of 0.05, and statistical power of 0.80, requiring a minimum of 34 participants. A total of 66 smokers were recruited through online social platforms, with the same eligibility criteria as Study 1. Participants were randomly assigned to the high smoker identity group or the low smoker identity group. Four invalid participants with a scenario judgment accuracy rate below 80% in the interpretive bias test were excluded, leaving 62 valid participants (49 male, 13 female). The high smoker identity group included 31 participants (26 male, 5 female), and the low smoker identity group included 31 participants (23 male, 8 female). There were no significant differences between the two groups in average age (20.84 years, SD=2.34 vs. 21.32 years, SD=1.85; t(60)=0.91, p=0.370), age of first smoking (17.42 years, SD=1.57 vs. 17.03 years, SD=1.72; t(60)=1.29, p=0.201), smoking duration (3.42 years, SD=2.42 vs. 4.29 years, SD=2.08; t(60)=1.51, p=0.135), average daily smoking quantity (8.26 cigarettes, SD=3.37 vs. 8.71 cigarettes, SD=3.86; t(60)=0.49, p=0.625), nicotine dependence (2.81, SD=1.70 vs. 3.45, SD=1.61; t(60)=1.53, p=0.130), or smoking craving (4.17, SD=1.19 vs. 4.52, SD=1.10; t(60)=1.20, p=0.237).
A 2 (Smoker Identity Group: High, Low) × 2 (Interpretation Target Sentence Type: Smoking related, smoking unrelated) mixed experimental design was used. Smoker identity was a between subject’s variable, interpretation target sentence type was a within subject’s variable, and the dependent variable was interpretive bias.
(1) Measure of interpretive bias: same as study 1.
(2) Materials for manipulating smoker identity: the social identity salience paradigm (Haslam et al.) [19] was used. In the high smoker identity group, participants were asked to write three things for each of the following four scenarios: “Three things you often do with most of your smoking friends or important members of the smoking group,” “Three things you and most of your smoking friends or important members of the smoking group rarely do,” “Three things you and most of your smoking friends or important members of the smoking group do well,” and “Three things you and most of your smoking friends or important members of the smoking group do not do well.” In the low smoker identity group, participants were asked to write three things for each of the following four scenarios: “Three things you often do,” “Three things you rarely do,” “Three things you do well,” and “Three things you do not do well.”
(3) Smoker Identity Scale: The Smoker Self Identity Scale (Moan, Rise) [31] was used. The scale includes 4 items (e.g., “I consider myself a smoker”), rated on a 7 point scale (1= completely inconsistent, 7= completely consistent). Higher scores indicate stronger identification with the smoker identity. The internal consistency coefficient (Cronbach’s α) of the scale in this study was 0.75.
(4) Other measures: Nicotine Dependence Scale, Smoking Craving Scale, and demographic questionnaire were the same as in Study 1.
The overall experimental procedure was as follows: 1) One day before the experiment, smokers were prescreened online or by phone and instructed not to smoke within 2 hours before the experiment. 2) Upon arriving at the laboratory, participants were informed of the experimental process and precautions. 3) Participants completed the informed consent form, demographic questionnaire, Nicotine Dependence Scale, and Smoking Craving Scale. 4) Participants were randomly assigned to the high or low smoker identity group and completed the corresponding identity manipulation task. 5) Participants completed the manipulation check for smoker identity. 6) Participants completed the interpretive bias test. 7) After the experiment, participants were paid and thanked.
Data processing was similar to Study 1, with the addition of one sample t tests and independent samples t tests to verify the effectiveness of the smoker identity manipulation.
Effectiveness of smoker identity manipulation
One sample t tests were used to examine the difference between each group’s smoker identity level and the midpoint (5.13). The results showed that the low smoker identity group’s score (M=4.39, SD=0.82) was significantly lower than the midpoint (t(30)=5.05, p<0.001), while the high smoker identity group’s score (M=6.13, SD=0.44) was significantly higher than the midpoint (t(30)=12.72, p<0.001). Independent samples t tests revealed that the high smoker identity group had significantly higher smoker identity scores than the low smoker identity group (t(60)=10.45, p<0.001, Cohen’s d=2.65). These results confirm the effectiveness of the smoker identity manipulation.
The effect of smoker identity on interpretive bias
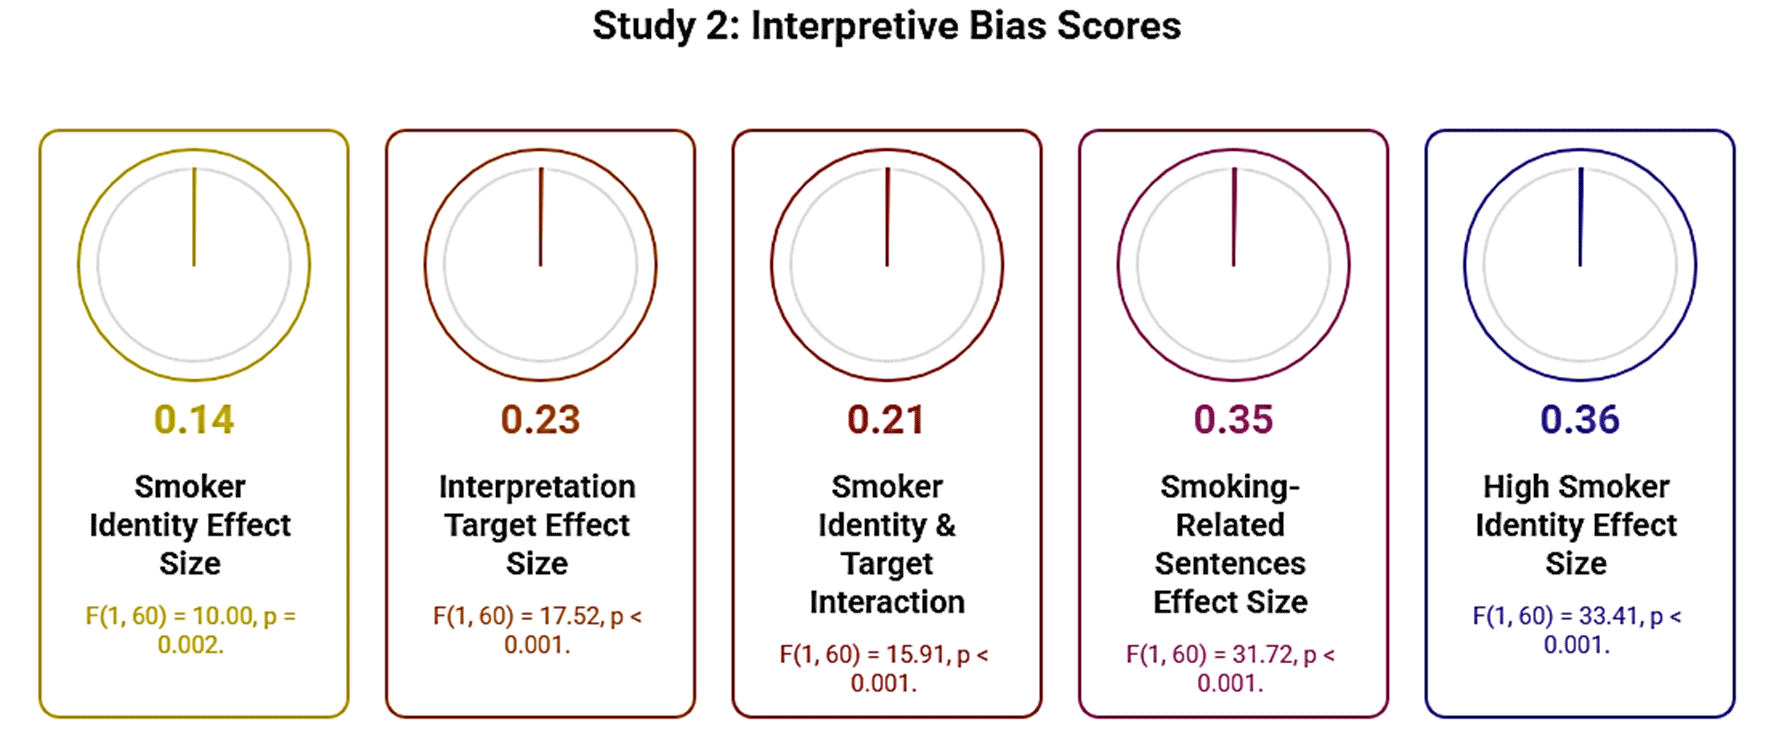
The smoking related and smoking unrelated interpretive bias scores of participants in Study 2 are shown in Figure 3. Repeated measures ANOVA on interpretive bias scores revealed a significant main effect of smoker identity (F (1, 60)=10.00, p=0.002, partial η²=0.14), with the low smoker identity group showing significantly lower interpretive bias than the high smoker identity group. A significant main effect of interpretation target sentence type was found (F (1, 60)=17.52, p<0.001, partial η²=0.23), with participants exhibiting significantly higher interpretive bias for smoking related sentences than smoking unrelated sentences. The interaction between smoker identity and interpretation target sentence type was significant (F (1, 60)=15.91, p<0.001, partial η²=0.21). Simple effects analysis showed that for smoking related sentences, the high smoker identity group’s interpretive bias scores (M=3.44, SD=0.25) were significantly higher than those of the low smoker identity group (M=2.88, SD=0.49) (F (1, 60)=31.72, p<0.001, partial η²=0.35). For smoking unrelated sentences, there was no significant difference between the high smoker identity group (M=2.84, SD=0.53) and the low smoker identity group (M=2.86, SD=0.44) (F (1, 60)=0.03, p=0.862). Additionally, for the high smoker identity group, interpretive bias scores for smoking related sentences (M=3.44, SD=0.25) were significantly higher than those for smoking unrelated sentences (M=2.84, SD=0.53) (F (1, 60)=33.41, p<0.001, partial η²=0.36). For the low smoker identity group, there was no significant difference between interpretive bias scores for smoking related sentences (M=2.88, SD=0.49) and smoking unrelated sentences (M=2.86, SD=0.44) (F (1, 60)=0.02, p=0.890).
Fig. 3. Smoking Related and Smoking Unrelated Interpretive Bias of Participants in Study 2 ↓
Study 3: The Effect of Smoker Identity on Smokers’ Interpretive Bias: The Role of Cognitive Load
Sample size was calculated using G*Power 3.1.9.7 software, with an effect size of 0.25, α error probability of 0.05, and statistical power of 0.80, requiring a minimum of 24 participants. A total of 64 smokers were recruited through online social platforms, with the same eligibility criteria as Study 1. Participants were randomly assigned to the high smoker identity group or the low smoker identity group. Four invalid participants with a scenario judgment accuracy rate below 80% in the interpretive bias test were excluded, leaving 60 valid participants (50 male, 10 female). The high smoker identity group included 30 participants (25 male, 5 female), and the low smoker identity group included 30 participants (25 male, 5 female). There were no significant differences between the two groups in average age (21.17 years, SD=2.87 vs. 20.97 years, SD=1.56; t(58)=0.34, p=0.738), age of first smoking (17.20 years, SD=1.75 vs. 16.93 years, SD=2.00; t(58)=0.55, p=0.585), smoking duration (3.97 years, SD=3.27 vs. 4.03 years, SD=2.09; t(58)=0.09, p=0.925), average daily smoking quantity (8.10 cigarettes, SD=5.33 vs. 8.57 cigarettes, SD=4.58; t(58)=0.36, p=0.717), nicotine dependence (3.83, SD=1.80 vs. 4.07, SD=1.23; t(58)=0.59, p=0.560), or smoking craving (4.72, SD=1.08 vs. 4.96, SD=0.57; t(58)=1.09, p=0.283).
A 2 (Smoker Identity Group: High, Low) × 2 (Interpretation Target Sentence Type: Smoking related, smoking unrelated) × 2 (Cognitive Load: High, Low) three factor mixed experimental design was used. Smoker identity was a between subject’s variable, while interpretation target sentence type and cognitive load were within subject’s variables. The dependent variable was interpretive bias.
(1) Measure of interpretive bias: Same as Study 1.
(2) Materials for manipulating smoker identity and Smoker Identity Scale: Same as Study 2.
(3) Materials for manipulating cognitive load and manipulation check: The cognitive load manipulation tool developed by Drichoutis and Nayga [12] was used, involving memorizing random numbers of different lengths. High cognitive load materials consisted of 7 digit random numbers (e.g., “1473268”), while low cognitive load materials consisted of 2 digit random numbers (e.g., “41”). The manipulation check questionnaire for cognitive load included 3 items: “How much mental effort did you invest in the number string memory task? (1= none at all, 7= All effort)”, “I did not have enough mental capacity to carefully consider my decisions. (1= completely disagree, 7= completely agree)”, and “The number string memory task distracted me while making decisions (1= completely disagree, 7= completely agree)”.
(4) Other measures: Nicotine Dependence Scale, Smoking Craving Scale, and demographic questionnaire were the same as in Study 1.
The overall experimental procedure was as follows: 1) One day before the experiment, daily smokers were prescreened online or by phone and instructed not to smoke within 2 hours before the experiment. 2) Upon arriving at the laboratory, participants were informed of the experimental process and precautions. 3) Participants completed the informed consent form, demographic questionnaire, Nicotine Dependence Scale, and Smoking Craving Scale. 4) Participants were randomly assigned to the high or low smoker identity group, completed the corresponding identity manipulation task, and filled out the manipulation check questionnaire for smoker identity. 5) Participants completed the cognitive load manipulation task (high or low, counterbalanced to control for order effects), followed by the cognitive load manipulation check questionnaire. 6) Participants completed the interpretive bias test. 7) Participants completed the other cognitive load manipulation task (low or high) and the corresponding manipulation check questionnaire. 8) Participants completed the interpretive bias test again. 9) After the experiment, participants were paid and thanked.
Data processing was similar to Study 2, with the addition of a manipulation check for cognitive load.
Effectiveness of Smoker Identity Manipulation
One sample t tests were used to examine the difference between each group’s smoker identity level and the midpoint (5.38). The results showed that the low smoker identity group’s score (M=4.47, SD=0.87) was significantly lower than the midpoint (t(29)=5.73, p<0.001), while the high smoker identity group’s score (M=6.11, SD=0.42) was significantly higher than the midpoint (t(29)=9.53, p<0.001). Independent samples t tests revealed that the high smoker identity group had significantly higher smoker identity scores than the low smoker identity group (t(58)=9.29, p<0.001, Cohen’s d=2.40). These results confirm the effectiveness of the smoker identity manipulation.
Effectiveness of Cognitive Load Manipulation
Paired samples t tests were used to examine differences in cognitive load levels between the two conditions. The results showed that participants’ scores under high cognitive load (M=5.23, SD=1.84) were significantly higher than those under low cognitive load (M=3.21, SD=1.00) (t(59)=19.03, p<0.001, Cohen’s d=1.64). These results confirm the effectiveness of the cognitive load manipulation.
The Effects of Smoker Identity and Cognitive Load on Interpretive Bias
The smoking related and smoking unrelated interpretive bias scores of participants in Study 3 are shown in Figure 4. Repeated measures ANOVA on interpretive bias scores revealed a significant main effect of smoker identity (F (1, 58)=9.77, p=0.003, partial η²=0.14), with the low smoker identity group showing significantly lower interpretive bias than the high smoker identity group. A significant main effect of interpretation target sentence type was found (F (1, 58)=29.40, p<0.001, partial η²=0.34), with participants exhibiting significantly higher interpretive bias for smoking related sentences than smoking unrelated sentences. The main effect of cognitive load was not significant (F (1, 58)=2.80, p=0.100). The interaction between smoker identity and interpretation target sentence type was significant (F (1, 58)=5.28, p=0.025, partial η²=0.08). The interaction between smoker identity and cognitive load was significant (F (1, 58)=7.78, p=0.007, partial η²=0.12). The interaction between interpretation target sentence type and cognitive load was not significant (F (1, 58)=2.79, p=0.100). The three way interaction was marginally significant (F (1, 58)=3.35, p=0.073, partial η²=0.06).
Simple effects analysis showed that for smoking related sentences: under low cognitive load, the high smoker identity group’s interpretive bias scores (M=3.55, SD=0.36) were significantly higher than those of the low smoker identity group (M=3.07, SD=0.43) (F (1, 58)=21.27, p<0.001, partial η²=0.27); under high cognitive load, the high smoker identity group’s scores (M=3.44, SD=0.39) were still significantly higher than those of the low smoker identity group (M=3.18, SD=0.51) (F (1, 58)=4.97, p=0.030, partial η²=0.08), but the significance was reduced. For smoking unrelated sentences: under low cognitive load, there was no significant difference between the high smoker identity group (M=2.84, SD=0.36) and the low smoker identity group (M=2.83, SD=0.38) (F (1, 58)=0.04, p=0.848); under high cognitive load, there was also no significant difference between the two groups (M=2.90, SD=0.35 vs. M=2.93, SD=0.44) (F (1, 58)=0.06, p=0.801).
Fig. 4. Smoking Related and Smoking Unrelated Interpretive Bias of Participants in Study 3 ↓
This study conducted three sub studies to investigate the characteristics of smokers’ smoking related interpretive bias, the effect of smoker identity on this bias, and the moderating role of cognitive load. Study 1 showed that smokers exhibited significantly higher smoking related interpretive bias than nonsmokers. Study 2 revealed that smokers with high smoker identity had significantly stronger smoking related interpretive bias than those with low smoker identity. Study 3 found that the effect of smoker identity on smoking related interpretive bias diminished as cognitive load increased.
Regarding the characteristics of smokers’ interpretive bias, this study confirms that smokers exhibit interpretive bias toward smoking related cues, supporting Hypothesis 1. Similar results have been found in other substance addiction research, particularly among drinkers [37, 42, 43]. For example, heavy drinkers are more likely to interpret alcohol related ambiguous scenarios in alcohol related ways than light drinkers [42]. Possible reasons for smokers’ smoking related interpretive bias include: First, the association between cues and automatic responses. According to the Incentive Sensitization Theory [34] and the Dual Process Model [36], repeated exposure to smoking related cues leads to the formation of automatic cue response associations in smokers, which triggers smoking related interpretive bias when facing smoking related stimuli or situations. Second, the impact of cues on cognitive function. According to the Cognitive Mechanisms of Addiction model [10], smoking related cues or situations activate smokers’ existing smoking related implicit cognition and impair the metacognitive system and executive function that monitor smoking behavior, leading to cognitive biases. Third, the role of rationalization beliefs. According to the theory of smoking rationalization beliefs [7], smokers are often aware of the health risks of smoking, which creates a conflict with their actual smoking behavior. This conflict causes discomfort, prompting smokers to form rationalization beliefs to reduce discomfort these beliefs may enhance or induce smoking related interpretive bias.
Regarding the inducing factors of smokers’ smoking related interpretive bias, this study shows that smoker identity induces such bias, supporting Hypothesis 2. Similar findings have been reported in other fields on the effect of identity on cognitive bias [1, 27]. For example, individuals’ identification with the vegetarian identity increases their attentional bias toward healthy food related cues [1]. Possible mechanisms underlying the effect of identity on smoking related interpretive bias include: First, the salience of smoker identity activates the association between the self and smoking. In fact, smokers have multiple identities [30], and when the smoker identity is salient, the association between the self and smoking is activated [17]. Due to the self-relevant information processing advantage effect [46], individuals may interpret ambiguous information based on the framework of the self-smoking association. Second, smoker identity activates positive attitudes toward smoking and cognition of smoking benefits. Through long term exposure to cigarettes and the pleasant experiences derived from smoking, smokers have formed positive evaluations and attitudes toward smoking [33]. According to Schema Theory (Beck, Haigh) [2], when processing ambiguous situations in depth, smokers are more likely to process information consistent with existing smoking related schemas in memory. Identity salience activates these evaluations and attitudes, providing a content basis for interpreting ambiguous information. Third, smoker identity activates smoking action schemas. Smoking action schemas include processes related to smoking behavior, such as the actions from lighting a cigarette to smoking [32]. Smoking is a hallmark behavior of smokers, and the salience of the smoker identity may activate these action schemas. According to Schema Theory [2], activated smoking action schemas or schema sets may combine with current ambiguous information, providing a content basis for smoking related interpretive bias.
Regarding the moderating role of cognitive load in the relationship between smoker identity and smoking related interpretive bias, this study shows that the effect of smoker identity decreases as cognitive load increases, supporting Hypothesis 3. This result indicates that sufficient cognitive resources enhance the effect of smoker identity on smoking related interpretive bias. Possible mechanisms include: First, processing information activated by identity may require cognitive resources. Identity provides relevant information for interpretive bias, and this information may be processed through two pathways [23, 30, 37]: automatic processing and controlled processing. Under high cognitive load, automatic processing of smoking related information is activated; under low cognitive load, sufficient cognitive resources support controlled processing of smoking related information. Second, processing information required for interpretive bias requires cognitive resources. The activation of smoker identity brings information about smoking identity, the pros and cons of smoking, and smoking actions. According to the Cognitive Mechanisms of Addiction model (Copersino, 2017), sufficient cognitive resources facilitate the full processing of this information particularly the effective retrieval, encoding, comparison, organization, sorting, and evaluation of relevant information, all of which require cognitive resources. Third, effective interpretive bias requires inhibiting interference from irrelevant information. According to the Cognitive Mechanisms of Addiction model [10], interpretive bias may be interfered with by irrelevant information, and inhibiting such interference requires cognitive resources. For smokers, information related to other identities (e.g., occupational identity) is also stored in long term memory and may interfere with smoking related interpretive bias suppressing this interference requires cognitive resources.
This study makes several theoretical contributions: First, by examining the characteristics of smokers’ smoking related interpretive bias, it expands the understanding of the components of smokers’ cognitive biases and broadens the explanatory scope of the Incentive Sensitization Theory, Dual Process Model, and Cognitive Mechanisms of Addiction model. Second, by demonstrating the inducing effect of smoker identity on smoking related interpretive bias, it enriches research on the influencing factors of smokers’ interpretive bias, supplements previous theories emphasizing the role of cue response associations (e.g., Incentive Sensitization Theory), and provides a new perspective for understanding the psychosocial mechanisms of addicts’ interpretive bias from a social cognitive orientation. Third, by revealing the moderating role of cognitive load, it enriches empirical research on the effect of identity on smoking related responses, identifies potential conditions for the effect of identity on interpretive bias, supplements previous theories explaining identity mechanisms (e.g., Schema Theory), and provides evidence for interpreting the mechanism of identity’s effect on interpretive bias based on the Dual Process Model.
This study also has practical implications for reducing national smoking rates and smokers’ smoking behavior in China: First, for the government, it is necessary to continue strictly implementing smoke free policies and expanding smoke free environments. This not only promotes smokers to restructure their interpretations of smoking related situations but also increases situations that induce nonsmoker identities, thereby reducing smoking related interpretive bias. Second, for media campaigns: on the one hand, smoking related scenes in film and television works should be strictly prohibited; on the other hand, advertisements promoting alternative interpretations of smoking related situations should be increased, helping smokers understand that common situations can be interpreted from multiple perspectives (e.g., stress can be relieved through deep breathing, exercise, or venting, not just smoking). Third, for clinical practitioners involved in smoking cessation interventions: when helping smokers quit, attention should be paid to correcting their smoking related interpretive bias. During correction, smokers’ “smoker identity” should be transformed into “ex-smoker identity” or “nonsmoker identity.” At the same time, smokers should be guided to allocate more cognitive resources to problem solving rather than smoking related content when facing difficulties, thereby preventing the activation of smoking related interpretive bias by smoker identity. Fourth, for smokers themselves: increasing interactions with nonsmokers or successful quitters can reduce smoker identity, helping them learn to view situations perceived as closely related to smoking from multiple angles and ultimately reducing smoking related interpretive bias.
This study has several limitations: First, the participants were all young smokers. Compared with middle aged and elderly smokers, young smokers have shorter smoking durations and lower nicotine dependence. Future research should compare the characteristics of smoking related interpretive bias among smokers with different smoking durations. Second, this study used behavioral experiments. Future research can combine cognitive neuroscience techniques to explore the neural mechanisms underlying the effects of smoker identity and cognitive load on smoking related interpretive bias. Third, in the laboratory setting, smokers were aware they were participating in an experiment, which may have led them to anticipate cues and affect experimental validity. Future research can use more ecologically valid methods such as ecological momentary assessment to study the effect of identity on interpretive bias. Fourth, smoking related interpretive bias does not necessarily translate into actual smoking behavior. The process by which cognitive bias influences behavior may be affected by numerous factors, and future research should further explore the specific psychological processes through which smoking related interpretive bias translates into smoking behavior.
CONCLUSION
1. In summary, this study investigated the characteristics, triggering factors, and moderating mechanisms of smokers’ smoking-related interpretive bias through three sequential sub-studies. Results confirmed that smokers demonstrate significantly higher smoking-related interpretive bias than non-smokers, supporting the extension of addiction cognitive theories to smoking behavior.
2. Additionally, smokers with a strong smoker identity exhibit more pronounced smoking-related interpretive bias compared to those with a weak identity, highlighting smoker identity as a key psychosocial trigger for this cognitive distortion.
3. Critically, cognitive load moderates the relationship between smoker identity and interpretive bias: the facilitating effect of smoker identity diminishes under high cognitive load, indicating that sufficient cognitive resources are necessary for identity to activate smoking-related interpretive bias.
4. These findings advance theoretical understanding of smokers’ cognitive biases by integrating social identity and cognitive resource perspectives, while offering practical implications for tobacco control.
5. Interventions targeting smoking cessation could focus on reshaping smoker identity and guiding cognitive resource allocation to reduce maladaptive interpretive tendencies, complementing existing tobacco control strategies.
Contributors:
Cheng Tongshun – conceptualization, methodology, supervision, funding acquisition;
Feroze Nazia – data curation, formal analysis, investigation, writing – original draft;
Farooq Muhammad Sabil – resources, validation, writing – review & editing.
Funding. This study was supported by the National Social Science Foundation of China (Grant No.: 22BSH089) and the Tianjin Social Science Foundation (Grant No.: TJSR2023-005).
Conflict of interests. The authors declare no conflict of interest.
REFERENCES
Key words: medical students, medical education, professionalism, prosocial behavior, medical ethics, student selection, preclinical education, humanistic values
Ключові слова: студенти-медики, медична освіта, професіоналізм, просоціальна поведінка, медична етика, відбір студентів, доклінічна освіта, гуманістичні цінності
Abstract
This study aims to compare the altruism levels of medical faculty students with other students and to understand the reasons for the decline of altruism in the medical profession. The sample consists of a total of 454 university students, comprising 309 females and 145 males, selected through random sampling from the faculties of medicine, education, and engineering. Data on altruism were obtained using the Altruism Scale, a Likert-type measurement tool that measures four sub-dimensions: family, social, helpful, and responsibility. The results revealed that medical students had significantly lower total altruism scores compared to both education and engineering students. This difference emerged most prominently in the "helpful" and "responsibility" sub-dimensions and could not be explained by demographic factors such as age and gender, or personality traits like extroversion. Furthermore, the findings showed that medical students already begin their education with a low level of altruism, and these levels remain statistically low without significant change throughout the preclinical years. The study concluded that the low altruism in medical students is not a result of an educational "erosion" of initially high ideals, but rather stems from structural factors. It is suggested that the student selection system for medical schools, which is highly competitive and based solely on multiple-choice tests, prioritizes academic achievement over humanistic values and thereby selects students who are motivated by status and career security rather than a desire to help. Additionally, the theory-heavy, competitive, and patient-distant preclinical educational environment fails to nurture or develop altruistic values. These findings challenge the dominant erosion narrative and indicate that a fundamental re-evaluation of student selection criteria and the educational curriculum is necessary to actively select for and cultivate altruism, a core value of the medical profession. It is recommended that longitudinal studies be conducted to follow students into their clinical years to observe further developments.
Реферат
Рівень альтруїзму студентів-медиків: порівняльна перспектива. Октар Сулейман, Октар Саліха. Метою цього дослідження є порівняння рівня альтруїзму студентів медичних факультетів з іншими студентами та розуміння причин зниження альтруїзму в медичній професії. До вибірки увійшли 454 студенти університету (309 жінок та 145 чоловіків), відібраних шляхом випадкового вибору з медичного, педагогічного та інженерного факультетів. Дані про альтруїзм були отримані за допомогою Шкали альтруїзму – інструменту вимірювання типу Лайкерта, що оцінює чотири підкатегорії: сімейний, соціальний, допомагаючий та відповідальний. Результати показали, що студенти-медики мали значно нижчі загальні бали альтруїзму порівняно зі студентами педагогічних та інженерних факультетів. Ця різниця найяскравіше проявилася в підкатегоріях «допомагаючий» та «відповідальний» і не могла бути пояснена демографічними факторами, такими як вік та стать, або особистісними рисами, як-от екстраверсія. Крім того, результати показали, що студенти-медики вже починають навчання з низьким рівнем альтруїзму, і цей рівень залишається статистично низьким без суттєвих змін протягом доклінічних років. У дослідженні зроблено висновок, що низький рівень альтруїзму в студентів-медиків не є результатом освітньої «ерозії» початково високих ідеалів, а випливає зі структурних факторів. Припускається, що система відбору студентів до медичних шкіл, яка є висококонкурентною та базується виключно на тестах з вибором відповідей, надає пріоритет академічним досягненням над гуманістичними цінностями, тим самим відбираючи студентів, мотивованих статусом та кар'єрною безпекою, а не бажанням допомагати. Крім того, теоретично насичене, конкурентне та віддалене від пацієнтів доклінічне освітнє середовище не сприяє вихованню чи розвитку альтруїстичних цінностей. Ці висновки кидають виклик домінантному наративу «ерозії» та вказують на необхідність фундаментального перегляду критеріїв відбору студентів та освітньої програми для активного відбору та культивування альтруїзму — основної цінності медичної професії. Рекомендується проведення поздовжніх досліджень для спостереження за студентами під час років їхнього клінічного навчання для вивчення подальших змін.
Altruism is considered a fundamental characteristic of the medical profession, with its roots tracing back to the Hippocratic Oath [1]. This concept remains one of the humanistic qualities at the core of medical professionalism, as Meskó and Spiegel (2022) emphasize that the spirit of compassion and responsibility embedded in the Hippocratic tradition continues to guide physicians and shape contemporary medical ethics in the digital health era [2]. As the medical profession is expected to involve compassionate care and helping behaviors, the view that medical professionals should be altruistic has long been prevalent [3]. Indeed, many physicians attribute their motivation for choosing medical school to altruism, often framed as a "calling" [4, 5]. Altruistic motivations, such as the desire to help people, are among the most dominant reasons for students to choose medical school [6, 7]. Along with values, compassion, honesty, and trustworthiness, altruism is so crucial to the nature of a physician's work that it is very difficult for any physician not deeply committed to these values to be a complete healer [8, 9]. In other words, physician behavior in health economics is modeled as incorporating patient health benefits directly into the physician’s utility function, reflecting an altruistic concern that distinguishes medical decision-making from purely profit‑maximizing conduct [10].
Despite the deep interconnection between the medical profession and altruism, there is a growing concern in the literature, especially in recent times, about the decline of altruism during the course of medical education [11]. Research demonstrates that medical students often enter their training with strong idealistic motivations; however, as their education progresses, these altruistic ideals and empathy tend to diminish or erode [12]. This phenomenon, commonly referred to as the “erosion of humanistic qualities,” highlights the tendency of students to become less sensitive over time [13, 14]. While some research focuses this decline on the clinical clerkships during the clinical years of education [12], more recent studies suggest that this decline in idealism begins much earlier [13, 14, 15]. Longitudinal studies, however, indicate that this decline particularly peaks during the clinical phase [1]. As highlighted by Lertsakulbunlue et al. (2024), the decline in empathy is largely driven by heavy workloads, stressful externship experiences, and non-humanistic informal practices within the medical culture – the so‑called hidden curriculum [16]. Emotional loneliness, stressful clinical demands, and non-humanistic practices within the hidden curriculum can foster emotional suppression and academic burnout among medical trainees [17, 18]. Burnout, in turn, is consistently linked to diminished empathy and altruistic attitudes, particularly through its negative association with cognitive empathy and patient-centered engagement [19, 20].
In this context, it is crucial to understand whether this decline in altruism in medical education is unique to the nature of the medical profession or if it is a general consequence of a demanding higher education process. This study aims to comparatively examine the altruism levels of medical students with those of students from the faculty of education, where altruistic behavior is also expected (such as in teaching), and students from the faculty of engineering. Through this comparison, the goal is to understand the potential underlying reasons for differences in altruism levels and to evaluate the relationship of these differences with demographic factors such as age, gender, and academic level.
MATERIALS AND METHODS OF RESEARCH
This study was conducted based on a re-analysis of an existing dataset used in a study we previously published [21]. This study was approved by the Human Research Ethics Committee (the letter number: 35877407/39) and was conducted in compliance with the requirements of the Declaration of Helsinki. The participants signed the written informed consent. The study was designed in a cross-sectional research model that examines the correlational structure between university students' altruism levels and their demographic characteristics.
The population of the research consists of students studying at a university (Konya, Türkiye). The sample is composed of a total of 454 university students selected through random sampling from among students in the faculties of medicine, education, and engineering. Of the participants, 309 were female (68.1%) and 145 were male (31.9%); the age range of the sample varies from 18 to 36.
The following criteria were established for participation in the study:
- Inclusion criteria: Being an undergraduate university student, attending formal (in-person) education, and having Turkish as a native language.
- Exclusion criteria: Being a postgraduate (master's or doctoral) student, being enrolled in distance or online education programs, and not having Turkish as a native language.
Demographic data includes: age, gender, faculty type, and class level. The author used the following measurement tools: Altruism Scale, Eysenck's Personality Inventory – Extroversion Subscale, and Social Problem-Solving Inventory – Short Form. The data obtained from the personality and problem-solving inventories were presented in the previous study [21]. Since the purpose of this study is to determine and interpret the altruism levels of medical students, only the data from the altruism scale were methodologically analyzed.
Altruism scale – to measure the altruism levels of the participants, the Altruism Scale, originally developed by London and Bower [22] and for which the Turkish validity and reliability study was conducted by Akbaba [23], was used. The scale consists of four sub-dimensions: family, social, helpfulness, and responsibility. It is a five-point Likert-type scale (scored from 1-5), with the lowest possible score being 20 and the highest 100. A higher score indicates a higher level of altruism. In the reliability study conducted in Türkiye by Akbaba [23], the correlation coefficient between the odd and even-numbered items on the scale was found to be significant at 0.81 (p<0.01). In the present study, the Cronbach's Alpha internal consistency coefficient for the scale was calculated as 0.798. In the analysis to determine the sample adequacy for the scale, the KMO (Kaiser-Meyer-Olkin) value was 0.785, and the Bartlett's test result was found to be statistically significant (χ²=2461.131; p<0.001).
All statistical analyses were performed using SPSS v.24 software (provided under an institutional license from Pamukkale University), and the significance level was set at p<0.05. The methodological basis for using parametric tests was confirmed by assessing the normality of the data distribution. Normality was assessed by examining Skewness and Kurtosis values [24]. As all Skewness values were found to be within the acceptable range of -1 to +1, the data were considered sufficiently normal to proceed with parametric tests. Therefore, Pearson correlation coefficient, independent samples t-test, and one-way ANOVA were used for the evaluation [25]. Quantitative data were presented as median and interquartile range (25th-75th percentiles), while qualitative data were presented as frequency (n) and percentage (%). Although the data met the assumptions for parametric testing, median and interquartile ranges were reported in accordance with the journal’s statistical reporting preferences.
In the analyses conducted to compare the total altruism and altruism sub-dimension scores according to faculty types, the Games-Howell post-hoc test was preferred for the "helpful" sub-dimension, where variances were not homogeneously distributed. For the total altruism score and the "family," "social," and "responsibility" sub-dimensions, where variances were homogeneous, the post-hoc Hochberg test was applied, taking into account the significant differences in the sample sizes (n numbers) of the groups. In the analyses comparing the total altruism and altruism sub-dimension scores of medical students according to their class (grade) levels, the post-hoc Gabriel test was used due to the similar sample sizes (n numbers) in the groups.
RESULTS AND DISCUSSION
According to the comparison among education, engineering, and medical students, the altruism levels of medical students are significantly lower than those of the other students (Table 1).
Education (n=164) Engineering (n=107) Medicine (n=183) Family 20 (18-22) 20 (18-22) 19 (17-22) Social 15 (12-18) 15 (12-18) 14 (11-17) Helpful 18 (15-20) 17 (15-20) 16 (13-19)* Responsibility 18 (16-20) 19 (17-20) 17 (15-19)* Altruism total 72 (64-77) 70 (63-77) 66 (60-74)* Notes: N=454; * p<0.05; **p<0.01; *** p<0.001; in post-hoc comparisons, the Games-Howell test was performed for “helpful” and the Hochberg test was performed for the other sub-dimensions.Table 1. Total altruism and sub-dimension scores by faculty [median (Q1-Q3)] ↓
To investigate this, medical students were compared with students from other faculties in terms of age and gender. The median age of medical students was lower than that of students in the other faculties, and this difference was statistically significant (one-way ANOVA, p<0.05). However, although the median age of medical students increased significantly across class years, with students in higher years being older than those in earlier years (one-way ANOVA, p<0.05), their altruism levels remained similar across classes (Table 2).
Family Social Helpful Responsibility Altruism total Class 1, n=71 19 (17-22) 14 (10-17) 16 (13-20) 17 (15-20) 64 (59-75) Class 2, n=62 21 (17-22) 15 (11-17) 17 (14-19) 18 (16-19) 69 (62-75) Class 3, n=50 19 (17-21) 14 (11-17) 15 (12-19) 17 (16-18) 63 (60-71) Notes: N=183; values are presented as median (Q1-Q3); no statistically significant differences were observed across class levels (one-way ANOVA, p>0.05).Table 2. Comparison of total altruism and sub-dimension scores of medical students by year of study [median (Q1–Q3)] ↓
Correlation analysis showed a weak but statistically significant positive association between age and the helpfulness sub-dimension when all students were analyzed (r=0.132, p=0.005), while no significant associations were found for total altruism or the other sub-dimensions. Among medical students, age was not significantly associated with altruism or any of its sub-dimensions (all p>0.05). Looking at the gender distribution, the gender distribution of medical students is similar to that of the faculty of education (Table 3).
Education n (%) Engineering n (%) Medicine n (%) Total n (%) Female, n (%) 133 (81.1) 44 (41.1) 132 (72.1) 309 (68.1) Male, n (%) 31 (18.9) 63 (58.9) 51 (27.9) 145 (31.9) Total, n (%) 164 (100) 107 (100) 183 (100) 454 (100) Note. Percentages are calculated within faculty; associations between gender and faculty were examined using the chi-square test (χ²=49.94, df=2, p<0.001).Table 3. Gender distribution of students by faculty [n (%)] ↓
In both faculties, the proportion of females is quite high. In the faculty of engineering, the proportion of males is significantly higher than in the other faculties. Accordingly, gender does not explain the difference in altruism among the faculties.
When comparing the total altruism and altruism sub-dimension scores of medical students by their class level, no significant differences were found (Table 2). At the same time, the altruism and subscale scores are similar for both female and male medical students (Table 4).
Across all students, altruism and most of its sub-dimensions did not differ by gender; however, female students scored higher on the helpfulness sub-dimension. This difference could not be explained by age, as age differences between females and males were not statistically significant either in the overall sample or among medical students (data not shown). In terms of personality, differences were examined with respect to extroversion-introversion, and extroversion levels were found to be similar across groups (data not shown), suggesting that the observed differences are unlikely to be attributable to personality traits.
Family Social Helpful Responsibility Altruism total Female, n=132 19 (17-22) 14 (11-17) 17 (13-20)* 17 (15-19) 66 (61-74) Male, n=51 19 (17-22) 15 (11-17) 16 (12-19) 17 (16-19) 65 (60-73) Notes: N=183; values are presented as median (Q1-Q3); comparisons between female and male students were performed using the independent samples t-test; p<0.05 indicates a statistically significant difference between genders.Table 4. Comparison of total altruism and subscale scores of medical students by gender [median (Q1–Q3)] ↓
The first significant finding of this study is that the altruism levels of medical school students are significantly lower compared to their peers in both the education and engineering faculties. While medical and teaching candidates are generally expected to be altruistic due to the human‑oriented nature of their professions [26], [27], recent evidence indicates that engineering students can display higher altruism scores than medical students. The fact that altruism – recognized as a central tenet of medical professionalism and a protective factor against burnout and stress [28, 29] – is lower among the very candidates for this profession, and that this deficit, particularly evident in the ‘helpfulness’ and ‘responsibility’ dimensions, cannot be accounted for by basic demographic or personality traits such as gender, age, or extroversion [21], indicates that its origins should be sought in structural and educational factors rather than individual temperament. The second important finding is that medical students possess a low level of altruism even in their first year of training, and this does not change in subsequent years. In other words, medical students are already distant from an altruistic motivation when they begin their professional journey. Despite this early deficit, recent systematic evidence shows that interventions such as reflective practice, peer feedback, and hidden curriculum exposure can foster empathy, compassion, and altruism among medical students, yet the sustainability of these gains remains uncertain [30]. Our findings indicate that the future practitioners of the profession are starting out with a deficit in this fundamental value.
Among the structural factors that need analysis, one of the most important is the student selection system for medical schools. For example, the student selection system in Türkiye is highly problematic: university admission is based on a multiple-choice central examination based on the high school curriculum, and no criteria other than academic achievement (such as interviews or social skills assessment) are included in student selection. A similar student selection system is implemented in many countries. Research shows that such examination systems hinder students' humanistic development and favor socioeconomically advantaged groups [31]. The fact that medical faculties admit students from the highest score brackets in this system means that these students have gone through a grueling pace of academic competition even before starting university. As this intense competition rewards academic success more than humanistic values, it causes the “new generation” of students to be driven not by altruistic motives like a traditional “calling” [5, 26, 30] or a ‘desire to help’ [27], but by more professional and materialistic motives such as the social status, job security, or financial expectations that come with winning this race. Evidence from recent studies further shows that stress, burnout, and competitive pressures erode empathy and altruism among medical trainees, reinforcing this shift toward pragmatic and material concerns [18, 19, 20]. Indeed, students with low levels of altruism are more inclined to choose high-income specialties [7] and are more sensitive to financial incentives [32]. While the “family” and “social” scores of medical students are similar to other students, their specifically low scores in “helpfulness” and “responsibility” suggest that they are consciously holding back in these areas and focusing their energy on their academic careers. This type of selection model for medical school also explains why our findings contradict the dominant “erosion” narrative in the international literature.
Many longitudinal studies in the literature suggest that students start medical school as idealists and that these ideals “erode” over time [11, 12] or they develop “emotional suppression and burnout” [17] due to the hardships of education (the hidden curriculum, stress, etc.). This decline can occur particularly with the start of the clinical period or sometimes at an earlier stage of training [33]. However, our cross-sectional findings show that medical students have lower altruism scores than other faculties even in their first year, and there is no significant change (decrease or increase) in these scores as they advance to upper classes (2nd and 3rd years). This “static” situation is partially supported by some other studies [34]. This indicates that the problem is not just an “erosion” experienced during education, but that its origin may largely lie at the point of entry into the faculty, that is, in the exam-oriented selection system [31].
Even if students entered the faculty with some altruistic motivation, the preclinical training environment (1st, 2nd, and 3rd years) where our study was conducted does not seem conducive to the development of these values. As in many countries, preclinical education in Turkey is largely provided by non-physician academics [35]. During this period, students are under intense pressure from theoretical education, and their encounters with patients are quite limited. Worse, there is a profile of a medical student who meets almost no clinicians in the early years of education. However, research shows that narrative-based education and real patient stories play a key role in developing empathy [36]. Despite this, opportunities to observe and interact with professional role models are largely postponed until the later years of medical education. Building on this, Tang et al. (2025) demonstrate through their Bow-Tie model that empathy and perspective-taking are most effectively nurtured when embedded into the curriculum, supported by collective reflection, and enriched by multi-stakeholder involvement [37]. Complementarily, Yang et al. (2025) highlight that empathy evolves from affective to cognitive forms across medical training, requiring sustained role modelling and early exposure to professional exemplars [38]. Taken together, these findings indicate that delaying meaningful role-model exposure to the later stages of training constitutes a structural limitation, depriving students of formative opportunities to integrate humanistic values, professional ethics, and altruistic skills throughout their education. This intense, competitive, and patient-distant environment may also be "flattening" individual differences such as gender. Although there are findings in the literature that female students are generally more altruistic [1] or empathetic, the disappearance of this difference specifically in the medical faculty in our study and in the study by Kraja et al. [34] suggests that the stress and risk of burnout [17] created by the environment suppress individual tendencies.
Recent literature has begun to question altruism in medicine, arguing that its association with self‑sacrifice is unsustainable in today’s high‑stress clinical environment [39]. This concept of "pathological altruism" can lead to burnout and depression in doctors [11]. Recent qualitative research indicates that medical students commonly perceive altruism as an expectation that goes beyond ordinary professional obligations and implies self-sacrifice, which they often regard as unrealistic in practice; consequently, they tend to prefer the broader and more sustainable notion of prosocial behavior when describing their professional motivations and responsibilities. Therefore, it is suggested that medical education adopt the more measurable and balanced concept of prosocial behavior rather than an idealized and difficult-to-operationalize notion of altruism (Jin et al., 2024). Prosocial behavior aims to benefit the patient while also encouraging the physician to balance their own well-being and self-care, thereby preventing burnout [29].
In conclusion, recent studies reveal that the altruism profile of medical students shows a worrying difference when compared to the ethical ideals of the profession and the profiles of students in other disciplines [32, 36, 40]. Our findings suggest that the problem is deeper than the simple “decline over time” or “erosion during training” narrative in the global literature, and the fact that this difference cannot be explained by demographic or basic personality traits places the responsibility directly on the education system itself. It is proposed that, particularly in the Turkish context, this problem stems from (1) a “selection system” that takes academic success as its sole criterion [31] and (2) a “preclinical education” structure that does not nurture altruism [35]. Considering that students who “truly want” to be healthcare personnel have higher levels of altruism [34], there is a risk that the current system is selecting the winners of the exam race instead of these students.
For the medical profession to preserve its nature of prioritizing the patients well-being, it is imperative that both student selection criteria and the educational curriculum re-evaluate altruism not as an assumption, but as a value that must be actively selected, taught, and protected [30, 36]. Furthermore, it is recommended to follow students through longitudinal studies to see if the declining trend in altruism is reversed during clinical training.
CONCLUSIONS
The aim of this study was to compare the altruism levels of medical students with those of students from other faculties (education and engineering) and to explore the possible structural factors underlying these differences.
Contributors:
Oktar Süleyman – conceptualization, data curation, formal analysis, funding acquisition, investigation, methodology, project administration, resources, software, supervision, validation, writing – original draft, writing – review & editing;
Oktar Saliha – conceptualization, data curation, formal analysis, investigation, methodology, project administration, resources, supervision, validation, visualization, writing – original draft, writing – review & editing.
Funding. This research received no external funding.
Conflict of interests. The authors declare no conflict of interest.
REFERENCES
Ключові слова: первинний склерозуючий холангіт, автоімунний склерозуючий холангіт, лікування, біохімічна відповідь, індекс SCOPE, еластографія зсувної хвилі
Key words: primary sclerosing cholangitis, autoimmune sclerosing cholangitis, treatment, biochemical response, SCOPE index, shear wave elastography
Реферат
Первинний склерозуючий холангіт та аутоімунний склерозуючий холангіт у дітей – це рідкісні хронічні захворювання печінки, що супроводжуються прогресуючим ураженням жовчних проток, розвитком фіброзу та ризиком формування біліарного цирозу. Автоімунний склерозуючий холангіт розглядається як окремий фенотип первинного склерозуючого холангіту дитячого віку, який поєднує риси автоімунного гепатиту та склерозуючого холангіту. Попри схожість патогенетичних механізмів, ці захворювання відрізняються клінічним перебігом, терапевтичною відповіддю та прогнозом. Ефективність лікування цих захворювань залишається недостатньо високою, що пов’язано з прогресуванням фіброзу жовчних проток навіть на тлі терапії. Відсутність біохімічної відповіді в перші 6-12 місяців уважається несприятливим прогностичним фактором і має розглядатися як підстава для ескалації терапії або переходу на альтернативні методи лікування. Оцінювання ефективності терапії є важливою умовою вчасного ухвалення рішень щодо зміни тактики лікування. Метою дослідження було оцінити ефективність лікування первинного склерозуючого холангіту та автоімунного склерозуючого холангіту в дітей протягом 12 місяців на основі динаміки біохімічної відповіді, показників жорсткості печінки за даними еластографії та прогностичного індексу SCOPE. У дослідження включено 56 дітей віком 2-18 років, які проходили обстеження та лікування у 2016-2024 роках у відділенні дитячої гепатології: Серед них 38 – з автоімунним склерозуючим холангітом, 18 – з первинним склерозуючим холангітом. Пацієнти першої групи отримували комбіновану імуносупресивну терапію, другої – урсодезоксихолеву кислоту. Через 12 місяців повна біохімічна відповідь досягнута в 47% та 67% дітей відповідно (р=0,27), нормалізація гамма-глутамілтрансферази – у 63% та 83% (р=0,21). Індекс прогнозу достовірно знизився в обох групах, а зменшення жорсткості печінки було статистично значущим лише в дітей з автоімунним склерозуючим холангітом (р=0,002). Отримані результати свідчать про часткову ефективність терапії та підкреслюють важливість комплексного моніторингу результатів лікування для своєчасного перегляду терапевтичної стратегії.
Abstract
Evaluation of the effectiveness of treatment of primary sclerosing cholangitis and autoimmune sclerosing cholangitis in children and adolescents. Dyba M.B., Berezenko V.S., Mykhailiuk H.Z., Tkalyk O.M. Primary sclerosing cholangitis and autoimmune sclerosing cholangitis in children are rare chronic liver diseases characterized by progressive bile duct damage, fibrogenesis, and a risk of developing biliary cirrhosis. Autoimmune sclerosing cholangitis is considered a distinct pediatric phenotype of primary sclerosing cholangitis, combining clinical and morphological features of both autoimmune hepatitis and sclerosing cholangitis. Despite similar immunopathogenetic mechanisms, these diseases differ significantly in clinical course, therapeutic response, and long-term prognosis. The overall effectiveness of treatment remains suboptimal, which may be related to the ongoing progression of bile duct fibrosis even under therapy. Lack of biochemical response within the first 6-12 months is considered an unfavorable prognostic factor and should be regarded as an indication for treatment escalation or transition to alternative therapeutic strategies. Evaluation of treatment efficacy is essential for timely decision-making regarding therapeutic adjustments. The aim of this study was to evaluate the effectiveness of treatment in children with primary sclerosing cholangitis and autoimmune sclerosing cholangitis over a 12-month period based on the dynamics of biochemical response, liver stiffness measurements assessed by elastography, and the SCOPE prognostic index. A total of 56 children aged 2 to 18 years, who underwent evaluation and treatment between 2016 and 2024 at a pediatric hepatology department, were included in the study: 38 with autoimmune sclerosing cholangitis and 18 with primary sclerosing cholangitis. Patients in the first group received combined immunosuppressive therapy, while those in the second group were treated with ursodeoxycholic acid. After 12 months of treatment, complete biochemical response was achieved in 47% and 67% of children, respectively (p=0.27), and normalization of gamma-glutamyltransferase in 63% and 83% (p=0.21). The prognostic index significantly decreased in both groups, while liver stiffness reduction was statistically significant only in children with autoimmune sclerosing cholangitis (p=0.002). These findings indicate partial treatment effectiveness and highlight the importance of comprehensive monitoring to support timely modification of therapeutic strategies.
Первинний склерозуючий холангіт (ПСХ) – хронічне прогресуюче захворювання гепатобіліарної системи невідомої етіології, яке характеризується запаленням та перидуктулярним фіброзом внутрішньопечінкових та/або позапечінкових жовчних проток, що призводить до їх звуження, облітерації та розвитку вторинного біліарного цирозу. ПСХ є рідкісним захворюванням у дітей, його поширеність варіюється від 0,2 до 1,5 випадку на 100 000 дитячого населення [1, 2]. Зазвичай це захворювання асоціюється із запальними захворюваннями кишківника (ЗЗК) та характеризується різноманіттям клінічної симптоматики. Для первинного склерозуючого холангіту (ПСХ) у дітей характерна фенотипова варіабельність, що включає ураження як великих, так і дрібних жовчних проток, а також особливий варіант перебігу – автоімунний склерозуючий холангіт (АСХ), який поєднує ознаки ПСХ та автоімунного гепатиту (АІГ) і є притаманним саме дитячому віку. У сучасній термінології для позначення цього клінічного фенотипу також використовують термін "overlap-синдром АІГ/ПСХ", що вказує на наявність одночасних ознак обох захворювань – автоімунного гепатиту та первинного склерозуючого холангіту [1, 3, 4, 5]. За даними епідеміологічних досліджень, поширеність АСХ становить 0,1-0,6 випадку на 100 000 дітей у США та Канаді. За даними літератури, майже 50% дітей з АІГ мають ознаки АСХ [4, 6]. Існує точка зору, що АСХ є ранньою «запальною» фазою ПСХ, яка з часом може трансформуватися в класичний фенотип ПСХ у старшому віці [5]. Прогноз для пацієнтів з АСХ є гіршим, ніж з АІГ, оскільки стандартна імуносупресивна терапія не завжди забезпечує повну ремісію. Однак, завдяки менш вираженому ураженню жовчних проток та за умови своєчасної діагностики й лікування, він більш сприятливий, ніж у хворих з ПСХ. АСХ частіше зустрічається в дітей і має зв’язок з HLA-алелями, подібними до АІГ [2, 5, 7, 8, 9].
На сьогодні не існує єдиних стандартів лікування ПСХ та АСХ у дітей, що пов’язано з варіабельністю клінічного перебігу, фенотиповою гетерогенністю та труднощами діагностики. Дані літератури свідчать про обмеженість сучасних терапевтичних підходів. Незважаючи на те, що окремі препарати покращують показники печінкових проб у хворих з ПСХ, все ще не вирішеним є питання уповільнення в них темпів фіброгенезу, підвищення довгострокової виживаності без трансплантації та покращення якості життя [10, 11, 12, 13].
Урсодезоксихолева кислота (УДХК) є одним з найбільш вивчених препаратів, який застосовується в лікуванні ПСХ, однак її ефективність у педіатричних пацієнтів залишається дискусійною [2, 3, 14, 15]. Дослідження показують, що низькі та помірні дози УДХК (10-15 мг/кг/добу) можуть покращувати біохімічні показники, зокрема рівні лужної фосфатази та ГГТ, проте немає переконливих доказів її впливу на уповільнення фіброзу чи зниження ризику трансплантації. Деякі ретроспективні дослідження свідчать про стабілізацію клінічного стану при тривалому прийомі УДХК, однак без суттєвого впливу на кінцеві клінічні результати, такі як потреба в трансплантації печінки [1, 3, 10].
Світові дослідження підкреслюють необхідність проведення подальших проспективних рандомізованих досліджень для розроблення ефективніших методів лікування та покращення прогнозу в дітей із ПСХ. Нещодавно проведені дослідження вказують на потенційну ефективність ванкоміцину, який модулює кишкову мікробіоту, важливу в патогенезі ПСХ. У пацієнтів, рефрактерних до терапії УДХК, ванкоміцин сприяв зниженню рівня ГГТ. Проте його довгострокова ефективність ще потребує подальшого дослідження [16].
У лікуванні дітей з АСХ ключовою є комбінована імуносупресивна терапія – глюкокортикостероїди та азатіоприн. Хоча така терапія забезпечує біохімічну відповідь у пацієнтів, її вплив на фіброз жовчних проток є обмеженим, що породжує дискусії щодо доцільної тривалості її застосування.
Прогноз ПСХ у дітей залишається несприятливим через обмежену ефективність терапії, високий ризик розвитку цирозу печінки та холангіокарциноми. Основною метою лікування є досягнення біохімічної ремісії та сповільнення прогресування фіброзу. Відсутність біохімічного покращення в перші 6-12 місяців є негативним прогностичним фактором, однак чіткі рекомендації щодо ескалації терапії або переходу на альтернативні методи лікування досі не визначені. Тому актуальним завданням є стандартизація біохімічних та інших неінвазивних маркерів для оцінювання ефективності терапії та прогнозування її результатів.
Аналіз сучасної літератури підтверджує відсутність єдиних критеріїв оцінювання ефективності лікування ПСХ у дітей. Використання лише біохімічних показників, таких як ГГТ і ЛФ, не завжди корелює з гістологічними змінами чи клінічними ускладненнями. Тому сьогодні зусилля вчених спрямовані на створення комплексної системи оцінювання, яка включатиме візуалізаційні методи (МРХПГ), біомаркери запалення та фіброзу, а також показники якості життя.
Оцінювання ефективності лікування АСХ базується на міжнародних рекомендаціях, подібних до тих, що використовуються для АІГ [17]. Воно передбачає визначення повної біохімічної відповіді – нормалізацію рівнів АЛТ, АСТ та IgG протягом шести місяців після початку терапії, а також аналіз часткової чи відсутньої відповіді. Для ПСХ ключовим маркером ефективності лікування в дітей є рівень ГГТ: його зниження на ≥75% через 6-12 місяців лікування вказує на позитивну динаміку, тоді як недостатнє зниження свідчить про рефрактерність до терапії [16, 18].
Сучасні рекомендації пропонують використовувати індекс SCOPE (Simple Clinical Outcome Prediction Index for Primary Sclerosing Cholangitis) для оцінювання ефективності лікування та прогнозу ПСХ у дітей. Він враховує рівень білірубіну, альбуміну, тромбоцитів, ГГТ та результати МРХПГ, що дозволяє прогнозувати ризик ускладнень, потребу в трансплантації печінки та ймовірність несприятливого перебігу протягом 5 років. Використання цього інструмента допомагає персоналізувати лікування, своєчасно виявляти пацієнтів з високим ризиком прогресування та коригувати терапевтичну стратегію.
Підсумовуючи сучасні дані щодо лікування ПСХ та АСХ у дітей, стає очевидним, що оцінювання ефективності терапії є ключовим завданням для своєчасного коригування лікування та покращення прогнозу в дітей з цими захворюваннями. Зважаючи на вищезазначене, у цьому дослідженні проведено оцінювання ефективності лікування первинного склерозуючого холангіту та автоімунного склерозуючого холангіту в дітей протягом 12 місяців на основі динаміки біохімічної відповіді, показників жорсткості печінки за даними еластографії та прогностичного індексу SCOPE.
МАТЕРІАЛИ ТА МЕТОДИ ДОСЛІДЖЕНЬ
У ретроспективний аналіз було включено 83 дитини (віком 2-18 років) з ПСХ (n=31) та АСХ (n=52), які перебували на лікуванні у відділенні дитячої гепатології ДУ «Всеукраїнський центр материнства та дитинства Національної академії медичних наук України» в період з 2016 до 2024 р. До групи АСХ були включені також пацієнти, яким у попередні роки виставлявся діагноз overlap-синдрому (АІГ/ПСХ), відповідно до клінічних, біохімічних та морфологічних ознак поєднаного перебігу захворювання. Дослідження відповідало Гельсінській декларації, було схвалене етичним комітетом ДУ «ВЦМД НАМН України», а батьки надали письмову інформовану згоду. Згідно з критеріями включення та виключення, до дослідження увійшли 56 пацієнтів, розподілених на дві групи залежно від діагнозу: автоімунний склерозуючий холангіт (АСХ, n=38) та первинний склерозуючий холангіт (ПСХ, n=18).
Діагностика проводилася за сучасними рекомендаціями та включала клінічні, біохімічні, імунологічні, інструментальні й гістологічні дослідження. ПСХ діагностували за характерним холестатичним клінічним та біохімічним профілем (свербіж, підвищення γ-глутамілтрансферази), змінами на холангіограмах (мультифокальні стриктури, сегментарне розширення жовчних проток) та гістологічними ознаками (перидуктальний фіброз, фіброзно-облітеруючий холангіт) [20]. АСХ встановлювали за критеріями АІГ (підвищення IgG, позитивні автоантитіла, гістологічні зміни, зокрема інтерфейс-гепатиту, розеткоутворення, емперіполезу, портальної інфільтрації з переважанням лімфоцитів і плазматичних клітин) [21] у поєднанні з типовими для ПСХ змінами, встановленими за даними магнітно-резонансної холангіопанкреатографії (МРХПГ) та/або морфологічного дослідження печінки. Діагноз АСХ визначався за шкалою ESPGHAN: ≥8 балів – підтверджений АСХ, 7 балів – ймовірний АСХ [3]. Вірусні гепатити та спадкові метаболічні захворювання печінки було виключено на підставі результатів відповідних лабораторних та інструментальних обстежень.
У ретроспективному аналізі враховано дані рутинних лабораторних та інструментальних обстежень. Лабораторні показники включали загальний аналіз крові, коагулограму (міжнародне нормалізоване відношення – МНВ), біохімічний аналіз – рівні аспартатамінотрансферази (АСТ), аланінамінотрансферази (АЛТ), γ-глутамілтрансферази (ГГТ, гамма-глутамілтрансферази), лужної фосфатази (ЛФ), загального білірубіну, загального білка, альбуміну та γ-глобулінів, а також імунологічні маркери: рівень імуноглобуліну G (IgG) та автоантитіла – антинуклеарні антитіла (ANA), антитіла до гладеньких м’язів (SMA), антитіла до печінково-ниркового мікросому 1 типу (LKM-1), цитоплазматичні антинейтрофільні антитіла з перинуклеарним типом флуоресценції (pANCA), антитіла до печінково-цитозольного антигену типу 1 (LC1). Для оцінювання прогнозу в пацієнтів з ПСХ та АСХ використовували індекс SCOPE (Sclerosing Cholangitis Outcomes in Pediatrics), який дозволяє стратифікувати ризик прогресування захворювання на основі лабораторних параметрів, що включають рівні загального білірубіну, альбуміну, тромбоцитів, ГГТ та дані холангіографії на початку терапії та через 12 місяців (19) . Інструментальні дослідження включали ультразвукове дослідження (УЗД) для оцінювання структурних змін печінки, стану внутрішньо- та позапечінкових жовчних шляхів, а також виявлення ознак портальної гіпертензії. Ступінь фіброзу визначали методом еластографії за рекомендаціями EFSUMB [22]. Еластографію печінки у 2015-2019 рр. проводили на сканері «Радмир ULTIMA», а з 2019 року — на системі Aplio i800 (Canon Medical Systems) з використанням 2D-SWE. Магнітно-резонансну холангіопанкреатографію для візуалізації жовчних проток виконано в 62 пацієнтів (29 з ПСХ, 36 з АСХ). Біопсію печінки проведено в 38 пацієнтів з АСХ та 18 з ПСХ. Ілеоколоноскопія виконана у всіх пацієнтів з ПСХ та АСХ. Езофагогастродуоденоскопію проводили пацієнтам із цирозом печінки та/або тромбоцитопенією (≤150 тис./мкл) з метою діагностики варикозного розширення вен стравоходу (ВРВС). Використані методи забезпечили комплексну оцінку стану печінки, жовчних шляхів та ускладнень захворювання.
Критерії включення:
- Вік пацієнтів 2-18 років.
- Підтверджений діагноз ПСХ або АСХ на основі гістологічних, лабораторних чи інструментальних досліджень.
- Спостереження ≥ 12 місяців.
- Наявність лабораторних, морфологічних та інструментальних даних до початку лікування, на 6-му та 12-му місяцях терапії.
Критерії виключення:
- Вірусні гепатити B і C.
- Спадкові захворювання печінки.
- Спостереження <12 місяців або відсутність необхідних лабораторних даних для оцінювання ефективності лікування.
Для оцінювання ефективності лікування використовували рекомендації міжнародної групи з автоімунного гепатиту (AIH) [11]:
- Повна біохімічна відповідь: нормалізація трансаміназ (АЛТ, АСТ) та рівня IgG до верхньої межі норми (ВМН) протягом 6 та 12 місяців після початку терапії.
- Недостатня відповідь: відсутність повної біохімічної відповіді через 6 місяців лікування.
- Непереносимість лікування: реєструвалася при виникненні побічних ефектів, які призводили до припинення застосування препаратів.
А також оцінювали ефективність лікування за рівнем ГГТ в сироватці крові [16, 18]:
- Відповідь на лікування: зниження ГГТ ≥75% від початкового рівня через 6-12 місяців лікування.
- Відсутність відповіді: зниження ГГТ <75% від початкового рівня.
Усі пацієнти з АСХ та ПСХ отримували УДХК у дозі 10-20 мг/кг/добу. Системну імуносупресивну терапію преднізолоном отримували 81,6% (n=31) дітей з АСХ та 11,1% (n=2) дітей з ПСХ. Азатіоприн у комбінації з преднізолоном або як монотерапію отримували 76,3% пацієнтів з АСХ (n=29) та 18,2% (n=4) пацієнтів з ПСХ. Препарати 5-аміносаліцилової кислоти (5-АСА) застосовували у 68,4% (n=23) дітей з АСХ і 72,2% (n=13) з ПСХ. Мікофенолату мофетил отримували 10,5% (n=4) дітей з АСХ, циклоспорин –2,63% (n=1), які призначали в разі непереносимості або недостатньої ефективності азатіоприну. Антибактеріальну терапію (ципрофлоксацин, ванкоміцин або рифаксимін) отримували 34,2% (n=13) пацієнтів з АСХ та 27,8% (n=5) з ПСХ через недостатню ефективність базисного лікування.
Статистичні методи дослідження проведено з використанням програми GraphPad Prism 10 (GraphPad Software Inc., США, GraphPad Prism 10.4.1.627, серійний номер GPS-2722055-T). Перевірку нормальності розподілу проводили за критерієм Колмогорова-Смирнова. Безперервні змінні подано як середнє ± стандартне відхилення (SD) або медіану (Me) з міжквартильним інтервалом [Q25; Q75] залежно від характеру розподілу. Для порівняння середніх значень між групами використовували t-критерій Стьюдента або U-критерій Манна-Вітні. Для аналізу динамічних змін у залежних вибірках застосовували повторний дисперсійний аналіз (Repeated Measures ANOVA) або тест Фрідмана залежно від характеру розподілу. Частотні показники порівнювали за допомогою точного тесту Фішера. Статистично вірогідними вважали результати при значенні p<0,05 [23].
Робота є фрагментом науково-дослідних робіт:
- 2016-2018 рр. «Дослідження ролі вітамін D залежних механізмів розвитку адаптаційних можливостей організму в критичні періоди дитинства та патогенезі хронічної соматичної патології у дітей», № державної реєстрації: 01.16U001202. Дизайн дослідження узгоджено на засіданні комісії з питань біоетики ДУ «ІПАГ НАМН України» (протокол № 3 від 23.06.2015);
- 2019-2021 рр. «Дослідження ролі вітамін D залежних механізмів розвитку адаптаційних можливостей організму в критичні періоди дитинства та патогенезі хронічної соматичної патології у дітей», № державної реєстрації: 01.16U001202. Дизайн дослідження узгоджено на засіданні комісії з питань біоетики ДУ «ІПАГ НАМН України» (протокол № 4 від 15.05.2018);
- 2022-2023 рр. «Оптимізувати методи профілактики і корекції недостатності та дефіциту вітаміну D у здорових дітей з груп ризику та при ревматичних хворобах і хронічних гепатитах», № державної реєстрації: 01.16U001202. Дизайн дослідження узгоджено на засіданні комісії з питань біоетики ДУ «ІПАГ НАМН України» (протокол № 4 від 13.04.21).
РЕЗУЛЬТАТИ ТА ЇХ ОБГОВОРЕННЯ
Вік пацієнтів у досліджуваних групах суттєво не відрізнявся: у групі АСХ – 11,1 ± 4,1 року, у групі ПСХ – 10,7 ± 3,8 року (р>0,05), таблиця 1. У групі АСХ частка дівчат становила 47%, що було вищим порівняно з групою ПСХ (28%), (p=0,24). Ураження великих жовчних проток діагностовано в 15 (83,3%) дітей з ПСХ та у 23 (70%) з АСХ, без суттєвої відмінності між групами, р>0,05.
Параметри АСХ, n=38 ПСХ, n=18 Вік, роки (Mean ± SD) 11,1 ±4,1 10,7±3,8 Дівчатка , n (%) 18 (47) 5 (28) Тромбоцити, Me [Q25; Q75] 245 (169; 411) 306 (238; 385) АЛТ, Me [Q25; Q75] 383 (241; 768,5) 214 (89; 466) АСТ, Me [Q25; Q75] 320 (200; 741) 146(63; 435)* ГГТ, Me [Q25; Q75] 167 (81,5; 300) 134 (61; 285) Білірубін, Me (Q25; Q75) 32 (15; 80) 14 (10; 20)* Загальний білок, г/л Me [Q25; Q75] 87 (81; 93) 77 (68;83)* Альбумін, г\л Me [Q25; Q75] 36 (32; 40) 43 (40; 45 )* МНВ, Me [Q25; Q75] 1,4 (1,2; 1,7) 1,2 (1,1; 1,3) IgG, г/л, Me [Q25; Q75] 22 (16; 29) 12 (9; 16)* γ-глобуліни % [Q25; Q75] 30 (27; 46) 18 (16; 28) Фіброз ≤ 2 ст., n (%) 13 (34) 9 (50) Фіброз ≥ 3 ст., n (%) 25 (66) 9 (50) Еластографія печінки, кПА [Q25; Q75] 11 (8; 15) 8 (6;11)* Цироз печінки, n (%) 11 (29) 4 (22) Портальна гіпертензія, n (%) 11 (29) 2 (21) ВРВС, n (%) 4 (10,5) 2 (11) Ураження великих жовчних проток 23 (60,5) 15 (83) ЗЗК 26 (68) 13 (72) Примітки: n – кількість дітей у групі; Ме – медіана; Q25 – перший квартиль; Q75 – третій квартиль; * – статистично значущі відмінності між групами за U-критерієм Манна-Вітні (p<0,05).Таблиця 1. Клініко-лабораторні та морфологічні показники в пацієнтів з АСХ та ПСХ перед початком лікування ↓
Аналіз лабораторних показників виявив характерні лабораторні зміни в кожній групі пацієнтів, що відображають різні механізми ураження печінки. У дітей з ПСХ рівні АСТ були значно нижчими, ніж у пацієнтів з АСХ (р=0,026 для АСТ), що свідчить про менш значне пошкодження гепатоцитів. Пацієнти з ПСХ також демонстрували нижчі рівні білірубіну порівняно з АСХ (р=0,02), що може бути пов’язано з ранньою стадією захворювання без типових ознак холестазу. Вищі рівні альбуміну в дітей з ПСХ порівняно з АСХ (р=0,01) разом з нижчими МНВ (р>0,05) свідчать про збережену синтетичну функцію печінки в дітей на початкових стадіях ПСХ. Рівень ГГТ в пацієнтів з ПСХ не мав суттєвої різниці з АСХ (р=0,49), що зумовлено схожістю механізмів ураження жовчних проток при ПСХ і АСХ. Імунологічний профіль пацієнтів з АСХ та ПСХ мав значні відмінності. Рівні IgG та γ-глобулінів були вірогідно вищими в пацієнтів з АСХ порівняно з ПСХ (p=0,006 і p=0,01 відповідно), що підтверджує наявність більш вираженого автоімунного компонента при АСХ. За даними біопсії, частка пацієнтів зі стадіями фіброзу ≤2 за Metavir була вищою в групі ПСХ (50%) порівняно з АСХ (34%), однак ця різниця не досягла статистичної значущості (p>0,05). Частота цирозу печінки також не відрізнялася між групами, становлячи 29% у пацієнтів з АСХ та 22% у хворих на ПСХ (p>0,05). За даними еластографії, показники жорсткості печінки були достовірно вищими в дітей з АСХ порівняно з ПСХ (p=0,01), що може бути зумовлено вищою активністю гепатиту в дітей з АСХ. Частота портальної гіпертензії становила 29% у групі АСХ та 21% у групі ПСХ, без статистично значущих відмінностей (p>0,05). Подібна тенденція спостерігалася щодо ВРВС, яке виявляли в 10,5% пацієнтів з АСХ та 11% з ПСХ (p>0,05).
Запальні захворювання кишківника часто спостерігалися в дітей з АСХ та ПСХ: у 68% при АСХ та в 72% при ПСХ, без статистично значущої різниці між групами (p>0,05). Ці дані вказують на можливі спільні механізми розвитку захворювань та підтверджують важливу роль ЗЗК як супутнього стану при холангіопатіях, що може впливати на підхід до діагностики та лікування.
Результати оцінювання відповіді на лікування наведено в таблиці 2.
Параметри 6-й місяць n (%) 12-й місяць n (%) Повна біохімічна відповідь через 6 та 12 місяців лікування АСХ (n=38) 12 (32) 18 (47) ПСХ (n=18) 7 (39) 12 (67) ГГТ відповідь (зниження ГГТ >75%) через 12 місяців лікування АСХ (n=38) - 25 (66) ПСХ (n=18) - 16 (89) ГГТ ≤50 Од/л на 12-му місяці лікування АСХ (n=38) - 24 (63) ПСХ (n=18) - 15 (83)Таблиця 2. Ефективність лікування дітей з ПСХ та АСХ на 6-му та 12-му місяці лікування ↓
Повна біохімічна відповідь через 6 місяців лікування
Через 6 місяців лікування повна біохімічна відповідь спостерігалася в 32% пацієнтів з АСХ та 39% пацієнтів з ПСХ, без статистично значущої різниці між групами (p>0,05). Низький рівень біохімічної відповіді в дітей з АСХ може бути пов’язаний із супутнім ураженням жовчних проток, що ускладнює контроль запального процесу. Імуносупресивна терапія при АСХ переважно спрямована на зменшення запалення в гепатоцитах, тоді як її вплив на патологічні зміни в жовчних протоках залишається обмеженим. У пацієнтів з ПСХ, які отримують монотерапію урсодезоксихолевою кислотою, оцінка ефективності лікування через 6 місяців не є ключовим показником. Дані щодо ПСХ в цей часовий проміжок наведено виключно для порівняння з пацієнтами з АСХ.
Повна біохімічна відповідь через 12 місяців лікування
Через 12 місяців лікування повну біохімічну відповідь спостерігали лише в 47% пацієнтів з АСХ та 67% пацієнтів з ПСХ (р=0,25). Нижчий показник у пацієнтів з АСХ вказує на труднощі лікування, пов’язані із супутнім ураженням жовчних проток, тоді як у групі ПСХ результати є кращими, ймовірно, через відмінності в тяжкості запалення.
ГГТ є важливим маркером холестазу та ураження жовчних проток у дітей. Пацієнти з ПСХ демонструють кращу біохімічну відповідь за рівнем ГГТ порівняно з пацієнтами з АСХ. Вищий відсоток ГГТ-відповіді (89% проти 66%, p=0,1) свідчить про кращу ефективність терапії щодо зниження холестазу в пацієнтів з ПСХ. Нормалізація рівня ГГТ через 12 місяців лікування також частіше досягалася в дітей з ПСХ порівняно з АСХ (83% проти 63%, p=0,21). Це може вказувати на варіабельність індивідуальної відповіді на лікування та вплив додаткових факторів на ефективність терапії, зокрема ступеня ураження жовчних проток і фіброзу печінки. Також можливим фактором, що впливає на зниження ГГТ, є відмінності в дозуванні урсодезоксихолевої кислоти (УДХК) між групами. Дітям з ПСХ зазвичай призначали УДХК в дозі 15-20 мг/кг/добу, тоді як пацієнтам з АСХ – 10-15 мг/кг/добу, що могло вплинути на ступінь біохімічної відповіді. Враховуючи можливий вплив дозування на ефективність терапії, цей аспект потребує подальших досліджень.
Прогностичний індекс SCOPE оцінює тяжкість перебігу захворювання та прогноз у пацієнтів з АСХ та ПСХ. Порівняння показників на початку лікування та через 12 місяців демонструє значне покращення стану пацієнтів в обох групах, таблиця 3.
Показник 0 міс 12 міс Значення р SCOPE АСХ (n=38) Me [Q25; Q75] 0-3 бали, n (%) 4-5 балів, n (%) 6-11 балів, n (%) 4 [3; 6]* 15 (39) 12 (32) 11 (29) 2 [1; 3] 32 (84) 5 (13) 1 (3) p<0,0001 ПСХ (n=18) Me [Q25; Q75] 0-3 бали, n (%) 4-5 балів, n (%) 6-11 балів, n (%) 4 [2–5]* 6 (33) 10 (56) 2 (11) 2 [1–2] 15 (83) 2 (11) 1 (6) p=0,001 Примітки: n – кількість дітей у групі; Ме – медіана; Q25 – перший квартиль; Q75 – третій квартиль; *— статистично значущі відмінності між групами за критерієм Вілкоксона для парних вибірок (p<0,05).Таблиця 3. Динаміка змін індексу SCOPE в дітей з ПСХ ↓
У дітей з АСХ на початку лікування медіана індексу SCOPE становила 4 [3; 6]; 39% мали низький ризик (0-3 бали), 32% – середній (4-5 балів), 29% – високий (6-11 балів). Через 12 місяців терапії медіана знизилася до 2 [1; 3], при цьому 84% пацієнтів перебували в групі низького ризику, 13% – середнього, 3% – високого. Динаміка SCOPE за рік лікування в групі АСХ була статистично значущою (p<0,0001).
У дітей з ПСХ на початку лікування медіана індексу SCOPE становила 4 [2-5]; 33% мали низький ризик прогресування, 56% – середній і 11% – високий. Через 12 місяців медіана знизилася до 2 [1-2], при цьому 83% пацієнтів мали низький ризик, 11% – середній і 6% – високий. Динаміка SCOPE за рік лікування в групі ПСХ також була статистично значущою (p=0,001).
Значне зниження показників SCOPE в пацієнтів з АСХ та ПСХ свідчить про високу ефективність лікування. Зменшення частки пацієнтів із середнім і високим ризиком прогресування захворювання вказує на зниження ймовірності розвитку ускладнень і покращення клінічного прогнозу в обох групах.
Ми також проаналізували динаміку жорсткості печінки, оціненої за допомогою еластографії, як потенційного критерію ефективності терапії. Порівняння показників на початку лікування та через 12 місяців виявило значне зниження жорсткості печінки в групі АСХ (p=0,002), тоді як у групі ПСХ статистично значущих змін не зафіксовано (p=0,1) (табл. 4).
У пацієнтів з АСХ жорсткість печінки, визначена еластографією, відображає як фіброзні зміни, так і запальну інфільтрацію, тому зниження цього показника на тлі імуносупресивної терапії свідчить насамперед про зменшення активності запалення. Натомість у хворих на ПСХ жорсткість печінки переважно зумовлена фіброзом і внутрішньопечінковим холестазом, а внесок запального компонента є незначним. У цьому контексті монотерапія УДХК, ефективність якої щодо зменшення фіброзу й контролю холестазу залишається обмеженою за даними численних досліджень, не забезпечує істотної динаміки показників жорсткості печінки.
Показник 0 міс Me [Q25; Q75] 12 міс Me [Q25; Q75] Значення р Еластографія, кПа ПСХ (n=20) 8 [6;11] 7 [5;9] р=0,10 АСХ (n=38) 11 [8;15]* 8 [7;11] р=0,002 Примітка. * – статистично достовірна відмінність у групі в динаміці спостереження (p<0,05, тест Вілкоксона для парних вибірок).Таблиця 4. Зміни показників жорсткості печінки (кПа) за даними еластографії в дітей з ПСХ і АСХ під впливом терапії ↓
Визначення повної біохімічної ремісії, як нормалізації рівнів амінотрансфераз та IgG, набуває дедалі більшого значення як клінічно досяжний та прогностично значущий сурогатний маркер гістологічної активності в пацієнтів з АІГ. Згідно з даними Hartl et al. (2022), лише 18% пацієнтів з АІГ, які перебували в стабільній біохімічній ремісії, мали залишкову гістологічну активність, і жоден не мав високої активності запалення. Натомість серед пацієнтів без біохімічної ремісії 70% мали персистуюче запалення. Ці результати підтверджують, що досягнення повної біохімічної відповіді може вважатися надійним критерієм контролю активності захворювання та ефективності імуносупресивної терапії при АІГ. Як зазначають автори цього дослідження, важливим аспектом є визначення не тільки рівня трансаміназ, але й IgG, оскільки серед пацієнтів з частковою біохімічною ремісією (нормальні рівні амінотрансфераз, але підвищений IgG) у 50% виявлено високу гістологічну активність, що додатково підкреслює прогностичну значущість одночасного контролю обох показників – АЛТ і IgG – саме в контексті автоімунного гепатиту. Дослідження Hartl et al. (2018) також продемонструвало, що повна біохімічна ремісія (нормалізація амінотрансфераз і IgG) є не лише маркером низької гістологічної активності, але й незалежним прогностичним фактором регресу фіброзу при АІГ. За умов стабільної біохімічної ремісії протягом 5,7 року жоден пацієнт не мав прогресування фіброзу, тоді як 43% хворих без ремісії продемонстрували прогресування фіброзу печінки [24].
У контексті ПСХ результати дослідження Deneau et al. (2018) демонструють, що зниження рівня ГГТ є важливим предиктором сприятливого прогнозу [18]. Так, у пацієнтів з рівнем ГГТ <50 Од/л через рік після встановлення діагнозу 5-річна виживаність без подій становила 91% порівняно з 67% при рівні ГГТ ≥50. Найкращі результати спостерігались у дітей, у яких протягом першого року рівень ГГТ знизився на ≥75% відносно вихідного значення (виживаність без подій – 88%), тоді як при зниженні на ≤25% вона становила лише 61%. Наведені дані підтверджують доцільність розгляду ГГТ як потенційного сурогатного маркера ефективності лікування ПСХ в дітей. Концепція так званого «ймовірного сурогатного маркера» (тобто такого, що з великою ймовірністю відображає вплив лікування на клінічно значущий результат) офіційно визнається Управлінням з контролю за продуктами і ліками США (FDA) як основа для прискореного затвердження ліків при повільно прогресуючих захворюваннях, таких як ПСХ, за наявності вагомих епідеміологічних підтверджень [25].
Результати нашого дослідження свідчать про складність досягнення повної біохімічної відповіді в дітей з АСХ навіть за умов комбінованої імуносупресивної терапії. Через 12 місяців лікування лише 47% дітей з АСХ досягли повної біохімічної ремісії, що узгоджується з результатами дослідження Giorgio A.D. et al., 2020 р, проведеному в King's College Hospital (Лондон, Великобританія), у якому 55% дітей з АСХ досягли ремісії [14]. Хоча імуносупресивна терапія залишається стандартом лікування АСХ, її ефективність щодо впливу на біліарний компонент захворювання є обмеженою [6], що підтверджується і нашими даними. Значна частка пацієнтів з АСХ не досягла нормалізації рівня ГГТ. Наші результати показали, що нормалізацію ГГТ вдалося досягти лише в 63% пацієнтів з АСХ, тоді як у групі ПСХ цей показник становив 83%. Подальші дослідження мають бути спрямовані на вивчення механізмів резистентності холангіопатій до імуносупресії, а також на пошук нових терапевтичних стратегій, які б дозволяли ефективно впливати на біліарні ураження при АСХ та ПСХ.
Особливістю нашого дослідження є включення одночасного оцінювання біохімічної відповіді, ГГТ-відповіді, індексу SCOPE, оцінювання жорсткості печінки як взаємодоповнювальних інструментів моніторингу ефективності лікування дітей з АСХ та ПСХ. Використання індексу SCOPE як прогностичного інструменту при ПСХ в дітей обґрунтовано численними дослідженнями. Хоча роль індексу SCOPE в щоденній клінічній практиці ще не визначена остаточно, його розглядають як корисне доповнення до загальної клінічної оцінки [19, 26, 27]. Оцінка індексу SCOPE у нашій когорті продемонструвала виражене зниження прогнозованого ризику в дітей з АСХ та ПСХ вже через 12 місяців лікування. У групі АСХ медіана індексу знизилась з 4 [3-6] до 2 [1-3] балів (p<0,0001), при цьому частка пацієнтів з високим ризиком (6-11 балів) зменшилась з 29% до 3%. Аналогічні тенденції спостерігались у групі ПСХ: зниження медіани з 4 [2-5] до 2 [1-2] балів (p=0,001), зменшення частки пацієнтів з високим ризиком з 11% до 6%. Зниження показника SCOPE на ранніх етапах лікування, зокрема через 12 місяців, може слугувати маркером покращення клінічного прогнозу, навіть якщо формально індекс був розроблений для довгострокової стратифікації. У дослідженні Hensel et al. (2021) було показано, що обчислення індексу SCOPE через 5 років після встановлення діагнозу дозволяє краще передбачити розвиток ускладнень, порівняно з розрахунком на момент діагностики для прогнозу трансплантації печінки або летального результату [28]. Зниження показника SCOPE вже протягом першого року може свідчити про позитивну динаміку захворювання та слугувати додатковим критерієм ефективності терапії в дітей з АСХ та ПСХ. Це особливо важливо в педіатричній практиці, де терапевтичні рішення часто потрібно ухвалювати з урахуванням активного росту, гормональних змін і ризику швидкого прогресування фіброзу.
Важливою особливістю нашого дослідження є застосування еластографії як додаткового неінвазивного маркера оцінювання відповіді на терапію в дітей з АСХ та ПСХ. Зниження жорсткості печінки за даними еластографії протягом першого року лікування було достовірним лише в пацієнтів з АСХ: медіана жорсткості печінки (кПА) зменшилася з 11 кПа [8; 15] до 8 кПа [7; 11] (p=0,002). Це може відображати зниження запалення в печінці, що підтверджується літературними даними про взаємозв’язок між активністю гепатиту та показниками жорсткості [22, 24, 29]. Натомість у дітей з ПСХ змін жорсткості печінки в динаміці не виявлено (8 кПа [6; 11] → 7 кПа [5; 9], p=0,10). Це узгоджується з відомими особливостями ПСХ, де переважають фібротичний та холестатичний компоненти ураження, а запальна активність є менш вираженою. Наразі нам не вдалося виявити досліджень, які б оцінювали динаміку показників еластографії в пацієнтів з ПСХ як маркер ефективності терапії. Натомість у пацієнтів з АСХ динаміка жорсткості печінки може виступати додатковим маркером ефективності терапії. Такий підхід узгоджується з результатами інших дослідників, які підтримують використання еластографії як чутливого інструменту моніторингу змін у печінковій тканині у відповідь на лікування автоімунних захворювань печінки [24, 30, 31].У цьому контексті доцільним є підкреслення ролі еластографії не лише як одноразового діагностичного інструменту, а й як засобу динамічного моніторингу ефективності лікування. Регулярне вимірювання жорсткості печінки дозволяє оцінювати зміну стану тканини без необхідності повторної біопсії, що особливо важливо в педіатричній практиці. Перспективним напрямом подальших досліджень є встановлення порогових значень змін жорсткості печінки, які б достовірно корелювали з регресом гістологічної стадії фіброзу. Визначення таких порогів дозволить підвищити клінічну цінність еластографії як неінвазивного сурогатного маркера гістологічного поліпшення активності та фіброзу печінки. Такий підхід відкриває можливість формування персоналізованих стратегій моніторингу, орієнтованих на довготривалий прогноз, зменшення необхідності інвазивних процедур та оптимізацію терапевтичного супроводу дітей з автоімунними захворюваннями печінки.
На сьогодні не розроблено ефективного методу лікування імунних холангіопатій, таких як АСХ та ПСХ, що підтверджується як результатами нашого дослідження, так і численними публікаціями інших авторів. Раніше повідомлялось, що застосування УДХК в дозах 13-15 мг/кг/добу може призводити до нормалізації рівнів печінкових ферментів, однак при цьому не виявлено позитивного впливу на довготривалий прогноз [32]. У нещодавньому ретроспективному дослідженні не було виявлено суттєвої різниці в клінічних наслідках між групами, які отримували УДХК, не отримували терапії або застосовували пероральний ванкоміцин [33]. Крім того, перебіг ПСХ в дітей характеризується природними коливаннями біохімічної активності, і спонтанна нормалізація печінкових ферментів не є рідкісною [27]. Однак згідно з дослідженням Deneau et al., 2018, нормальний рівень ГГТ через 1 рік досягнуто у 53% пацієнтів, які отримували УДХК, і лише у 29% тих, хто її не отримував [18]. У нашому дослідженні УДХК отримували всі пацієнти з АСХ і ПСХ, а 4% отримували ванкоміцин. Проте ретроспективний дизайн не дозволяє однозначно оцінити ефективність цієї терапії.
Обмеженням нашого дослідження є ретроспективний дизайн, невелика вибірка пацієнтів з ПСХ, а також різна тривалість перебування на терапії до моменту включення в дослідження. Проте перевагами є динамічне спостереження впродовж 12 місяців і використання декількох комплементарних критеріїв ефективності (біохімічні показники, еластографія, індекс SCOPE).
ВИСНОВКИ
1. Ефективність терапії в дітей з автоімунним склерозуючим холангітом та первинним склерозуючим холангітом залишається помірною: повну біохімічну відповідь та нормалізацію рівня γ-глутамілтрансферази через 12місяців лікування досягнуто лише в 47% і 63% пацієнтів з автоімунним склерозуючим холангітом та в 67% і 83% з первинним склерозуючим холангітом відповідно, що свідчить про необхідність удосконалення терапевтичних підходів.
2. Визначення жорсткості печінки за допомогою еластографії є чутливим маркером ефективності лікування в перші 12місяців терапії в дітей з автоімунним склерозуючим холангітом і може розглядатися як додатковий критерій ефективності імуносупресивної терапії.
3. Оцінювання біохімічної відповіді, рівня γ-глутамілтрансферази та розрахунок прогностичного індексу SCOPE (Sclerosing Cholangitis Outcomes in Pediatrics) є неінвазивними інструментами, які доцільно включати до системи моніторингу ефективності лікування та оцінювання прогнозу в дітей з автоімунним і первинним склерозуючим холангітом.
Внески авторів:
Диба М.Б. – концептуалізація, методологія, дослідження, аналіз, написання статті, редагування;
Березенко В.С. – рецензування та редагування;
Михайлюк Х.З., Ткалик О.М. – дослідження.
Фінансування. Дослідження не має зовнішніх джерел фінансування.
Конфлікт інтересів. Автори заявляють про відсутність конфлікту інтересів.
REFERENCES
Ключові слова: променева терапія, медичні зображення, оптична щільність, поглинена доза, невизначеності
Key words: radiotherapy, medical images, optical density, absorbed dose, uncertainties
Реферат
Якість променевої терапії значно покращилася завдяки використанню нових джерел та видів опромінення, а також сучасного тривимірного планування. Проте рівень променевих пошкоджень залишається суттєвим, що зумовлює необхідність аналізу точності інструментів, які забезпечують формування зображень і розрахунок доз. Метою роботи було визначення ймовірних невизначеностей, що виникають при використанні програмного забезпечення рентген-комп’ютерного томографа «TOSHIBA Asteion Super 4» та планувальних систем прискорювача електронів «Elekta Synergy» (Elekta Limited), а також пошук шляхів зменшення цих невизначеностей. Було проаналізовано 28 планів променевої терапії хворих, яка проводилася на прискорювачі електронів «Elekta Synergy» за останні чотири роки. Для оцінювання параметрів зображення аналізували дані рентген-комп’ютерної томографії з товщиною реконструкції 1,5 мм, оброблені програмою «eFilm». Визначали розмір пікселя, кількість пікселів у заданому фрагменті, площу та оптичну щільність різних ділянок зображення. Невизначеності дозового планування оцінювали в програмі «Monaco Treatment Planning System» на основі значень поглинутих доз у зонах з мінімальною оптичною щільністю всередині контурів об’єкта опромінення, у чорному фоні внутрішніх порожнин та за межами зовнішнього контура тіла. Встановлено факт некоректного визначення програмою «eFilm» геометричних параметрів зображення з похибкою 8-15%. Значення оптичної щільності в чорному фоні варіювали від -1000 HU біля меж об’єкта до -834 HU на більшій відстані. Показано значні коливання поглинутих доз у зонах низької щільності: при однакових умовах вимірювання доза могла становити як 0,0 Гр, так і 15,4 Гр. На відстані 4 мм від зовнішнього контура при щільності -1001 HU доза дорівнювала 5,9 Гр і зростала при наближенні до контура. Отримані результати свідчать, що похибки формування DICOM-зображень і розрахунку доз можуть зумовлювати істотні невизначеності, які впливають на точність планування та ефективність лікування. Удосконалення програмного забезпечення комп'ютерної томографії (КТ) та планувальних систем розглядається як перспективний шлях для зменшення таких похибок.
Abstract
The uncertainties in radiation therapy planning. Kikhtenko I.M., Khvorostenko Y.M., Filonenko N.Yu., Haldina O.M. The quality of radiation therapy has significantly improved due to the introduction of new irradiation sources, advanced delivery techniques, and modern three-dimensional treatment planning. However, the level of radiation-induced damage remains considerable, necessitating an assessment of the accuracy of tools responsible for image generation and dose calculation. The aim of the study was to identify potential uncertainties arising from the use of the TOSHIBA Asteion Super 4 computed tomography software and the planning systems of the Elekta Synergy linear accelerator (Elekta Limited), as well as to determine approaches for reducing these uncertainties. Twenty-eight patient radiotherapy plans carried out on the Elekta Synergy accelerator within the past four years were subjected to analysis. To evaluate image parameters, computed tomography data with a slice reconstruction thickness of 1.5 mm processed using the eFilm software were analysed. Pixel size, the number of pixels within a selected region, area, and optical density of various image segments were measured. Dose-planning uncertainties were estimated in the Monaco Treatment Planning System software based on absorbed-dose values in regions with minimal optical density inside the irradiation target contours, in the black-background cavities within the object, and outside the external body contour at various distances. The analysis revealed incorrect determination of image geometric parameters by eFilm, with an error of 8-15%. Optical-density values in the black background ranged from –1000 HU near the object boundary to -834 HU at greater distances. Significant variations in absorbed dose were observed in low-density regions: under identical conditions, dose values ranged from 0.0 Gy to 15.4 Gy. At a distance of 4 mm from the outer contour, an optical density of -1001 HU corresponded to a dose of 5.9 Gy, increasing with proximity to the contour. These findings indicate that errors in DICOM-image formation and dose calculation may introduce substantial uncertainties affecting treatment-planning accuracy and therapeutic outcomes. Improving computed tomography (CT) image-processing software and radiotherapy planning systems is considered a promising approach to reducing such uncertainties.
Захворюваність на онкологічну патологію у світі невпинно зростає. За даними ВООЗ, у 2022 році було зареєстровано 20 млн нових випадків раку, з яких 9,7 млн завершилися летально; кількість пацієнтів, що пережили п’ятирічний рубіж, становила 53,3 млн. За прогнозами, до 2050 року захворюваність зросте на 77% і досягне 35 млн випадків, при цьому в країнах з низьким індексом розвитку людського потенціалу приріст може становити до 142% порівняно з 2022 роком [1]. У США у 2025 році очікується близько 2 041 910 нових випадків раку (приблизно 5600 щодня), тоді як у світі цей показник перевищить 52 900 випадків на добу [2, 3].
В Україні зберігається світова тенденція зростання онкологічної захворюваності. Так, за даними Національного канцер-реєстру України, у 2024 році на обліку перебувало понад 1,1 млн пацієнтів з онкологічними захворюваннями. Серед хворих, що перебували під спостереженням упродовж п’яти років, чоловіки працездатного віку становили 39,9%, жінки – 48,1%, з яких 9,9% були репродуктивного віку; решта – особи пенсійного віку [4]. Пропорційно зростає також кількість пацієнтів, які отримують комбіноване спеціалізоване лікування, що включає хірургічний, променевий та хіміо-гормональний або імунний компоненти [5].
Променева терапія є ключовою складовою багатокомпонентного лікування раку [6, 7]. За даними ВООЗ, понад 50% онкологічних пацієнтів потребують променевої терапії при лікуванні найбільш поширених форм злоякісних новоутворень [8], і щороку близько 7 млн хворих у світі проходять відповідні курси лікування. Водночас навіть застосування сучасних променевих технологій не усуває ризику розвитку променевих ушкоджень нормальних тканин і вторинних злоякісних новоутворень [9]. Зокрема, від 74 до 100% жінок після опромінення з приводу раку молочної залози мають прояви ушкодження шкіри, серед яких променевий фіброз є тяжким, прогресуючим та незворотним пізнім ускладненням. Частота радіаційно-індукованих уражень легень становить 4,5-63% у проспективних і 0,9-30% у ретроспективних дослідженнях [10], а ризик розвитку серцевої недостатності внаслідок дифузного фіброзу міокарда зростає в 16 разів [11].
Таким чином, зростання кількості онкологічних пацієнтів й обсягів променевої терапії робить проблему променевих ушкоджень нормальних тканин особливо актуальною. Незважаючи на вдосконалення технологій опромінення та сучасне тривимірне планування, променеві ускладнення залишаються поширеними, що пов’язують з невизначеностями, притаманними багатокомпонентному процесу підготовки та проведення лікування із застосуванням складної апаратури [12]. Через це питання невизначеностей активно опрацьовують на національному та міжнародному рівні [13]. Сучасні підходи до оцінювання невизначеностей у променевій терапії базуються на рекомендаціях провідних міжнародних організацій, зокрема AAPM та IAEA [15-19]. Згідно з AAPM TG-132 [20] та TG-179 [21], геометричні та дозиметричні невизначеності можуть виникати на всіх етапах – від отримання зображень до планування та реалізації лікування. Також у цитованих документах підкреслюється критична роль точності визначення об’ємів, зв’язку між HU й електронною щільністю та акцентується увага на необхідності систематичного контролю якості, калібрування перетворення КТ-чисел у щільність та врахування алгоритмічних похибок TPS.
Результати досліджень розподілу доз на фантомних моделях свідчать про зменшення доз поза полем із віддаленням від його краю та зі збільшенням глибини [22], водночас на периферії поля може спостерігатися локальне зростання дози. Так, для прискорювача Oncor зафіксовано пік периферичної дози до 1,4% на відстані 6 см від краю поля 10×10 см² для електронних пучків 6 і 9 МеВ, а для 15 МеВ – до 2,3% за аналогічних умов [23]. Це зумовлено інтенсивним розсіюванням електронів у головці прискорювача, аплікаторах, вирізах і повітрі, що призводить до утворення фотонного випромінювання та електронів низької енергії і формування клінічно неприйнятної півтіні. Інші дослідження виявили піки периферичної дози на відстані 12-15 см за краєм поля [24], а максимальні значення – для електронних пучків з енергією 18 МеВ [25]. У літературі підкреслюється критична важливість контролю периферичних доз й оптимізації апаратного забезпечення з метою підвищення безпеки пацієнтів [26], а одним з резервів покращення результатів лікування вважається виявлення та мінімізація неврахованих невизначеностей [27].
Для планування променевої терапії найчастіше використовують дані рентген-комп’ютерної томографії, що зберігаються у форматі DICOM – міжнародному стандарті медичних зображень, підтримуваному провідними виробниками радіологічного обладнання [28, 29]. Одним з поширених програмних продуктів для їх аналізу є «eFilm». Проведений нами аналіз КТ-зображень показав, що навіть за дослідження однієї й тієї ж анатомічної ділянки на одному апараті та за однакових режимів вимірювані параметри можуть відрізнятися за розмірністю пікселя та щільністю [30]. З огляду на те, що в окремих випадках межу між нормою і патологією визначають десяті частки міліметра та кілька одиниць Хаунсфілда, а піксель (воксель) є базовою структурною одиницею планування конформної променевої терапії, доцільним є детальне дослідження його характеристик [31] та особливостей розподілу поглинутих доз у системах планування і гарантії якості радіотерапії.
Сучасний розвиток технологій штучного інтелекту суттєво трансформує процеси планування променевої терапії, зокрема етап сегментації та контурингу [32]. Сучасні алгоритми реконструкції КТ-зображень, зокрема ітеративної реконструкції зображень та реконструкції КТ-зображень на основі глибинного навчання (deep learning-based reconstruction, DLR) [33], можуть змінювати значення HU, зменшувати шум та згладжувати границі структур, що потенційно впливає на точність сегментації та дозиметричних розрахунків. За даними сучасних досліджень [34-37], відхилення HU при використанні DLR можуть досягати клінічно значущих величин, особливо на межах тканин. Це створює додаткові джерела систематичних невизначеностей у плануванні променевої терапії.
Метою цієї роботи було наукове обґрунтування та експериментальне дослідження впливу геометричних і дозиметричних невизначеностей, пов’язаних із характеристиками пікселів і вокселів DICOM-зображень рентген-комп’ютерної томографії, на формування планів променевої терапії та визначення поглинутих доз у зонах клінічного інтересу.
МАТЕРІАЛИ ТА МЕТОДИ ДОСЛІДЖЕНЬ
Рентген-комп’ютерну томографію (РКТ) пацієнтів з пухлинами мозку виконували на комп’ютерному томографі TOSHIBA Asteion Super 4. Аналізували поперечні зрізи з товщиною реконструкції 1,5 мм за допомогою програми обробки DICOM-файлів «eFilm» («Phillips Medical MXLiteView Version 1.22 MS»), яка дозволяє визначати розміри пікселя, кількість пікселів у заданій області, площу та оптичну щільність зображення.
На площині зрізу прямокутним маркером ROI Rectangle виділяли ділянки пухлини розміром 1-28 суміжних пікселів, розташованих у ряд. На одному зрізі аналізували шість таких ділянок – максимальну кількість, що допускається програмою, кожну з яких маркували окремим кольором. Розміри полів, їх площа, кількість пікселів та оптична щільність автоматично визначалися програмою і відображалися у вигляді цифрових значень, які заносили до таблиць для подальшого порівняння з результатами ручних вимірювань.
Крім того, визначали оптичну щільність ділянок поза межами об’єкта дослідження (чорний фон). Для цього квадратним маркером виділяли шість ділянок розміром один піксель кожна на різній відстані по променю від краю контура зображення. Отримані дані також табулювали та аналізували.
Невизначеності, що виникають при плануванні променевої терапії на електронному прискорювачі Elekta Synergy з використанням планувальної системи Monaco TPS, оцінювали за даними розподілу поглинутих доз на поперечних зрізах. Аналіз проводили в зонах з мінімальною оптичною щільністю всередині контурів об’єкта, у чорному фоні порожнин, а також у ділянках поза зовнішніми контурами тіла пацієнта на різних відстанях.
Клінічні методи обстеження (інструментальні та лабораторні) застосовувалися відповідно до сучасних рекомендацій [14-16, 38-42]. Рандомізоване дослідження проведено за даними комп’ютерного планування у 28 хворих зі злоякісними новоутвореннями молочної залози, головного мозку, гортані та стравоходу.
Кількісні та якісні дані були подані відповідно до загальноприйнятих статистичних підходів. Статистичний аналіз даних 28 планів променевої терапії проводився із застосуванням критерію χ², критерію Вілкоксона – Манна – Вїтні та пермутаційного підходу [43, 44]. Для всіх оцінок використовувався рівень довірчої ймовірності 97,5%, що забезпечує високу надійність інтервалів. Обчислення виконувалися в програмному середовищі Python 3.14.2 (Python Software Foundation License, вільне програмне забезпечення) за допомогою хмарного застосунку Google Colab, Free License) з використанням модуля stats бібліотеки SciPy (безкоштовна бібліотека Python з відкритим кодом, яка використовується для наукових та технічних обчислень, що не передбачає індивідуального номера ліцензії).
Дослідження схвалені комісією з питань біомедичної етики ДДМУ (витяг з протоколу № 32 від 11.11.2025 р.) та проведені згідно з письмовою згодою учасників і відповідно до принципів біоетики, викладених у Гельсінській декларації «Етичні принципи медичних досліджень за участю людей» та «Загальній декларації про біоетику та права людини (ЮНЕСКО)».
РЕЗУЛЬТАТИ ТА ЇХ ОБГОВОРЕННЯ
Дані вимірювання розміру пікселів на знімках хворої К. подано на рисунку 1.
Отримані дані програмного визначення розміру пікселя, довжини виділеної ділянки зображення, її площі, а також розрахункового розміру пікселя, довжини та площі зображення внесені до таблиці 1.
Рис. 1. Різний розмір суміжних пікселів на зображенні поперечного зрізу хворого: 1 – довжина вимірюваного відрізка; 2 – кількість пікселів, площа, оптична щільність ↓
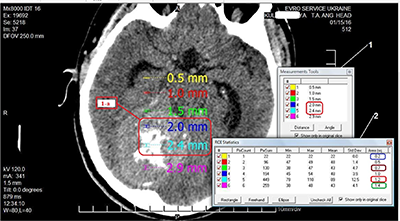
Кількість Пікселі (мм) Площа (мм2) розмір (програма) розмір (розрахунок) розмір (програма) розмір (розрахунок) 1 0,5 0,5 0,2 0,25 2 1 1 0,5 0,5 3 1,5 1,5 0,7 0,75 4 2,0 2,0 1,0 1,0 5 2,4 2,5 1,2 1,25 6 2,9 3,0 1,4 1,5Таблиця 1. Розміри пікселя та його похідних у пацієнтки К. ↓
В іншої пацієнтки Ів., у якої поперечні зрізи головного мозку були виконані на тому ж апараті та за аналогічних умов, було отримано результати, подані на рисунку 2.
Отримані дані програмного визначення розміру пікселя, довжини та площі виділеної ділянки зображення, а також розрахункових значень розміру пікселя, довжини та площі зображення внесено до таблиці 2.
Рис. 2. Пацієнтка Ів. Різний розмір пікселів на зображенні поперечного зрізу: 1 – довжина вимірюваного відрізка; 2 – кількість пікселів, площа, оптична щільність ↓
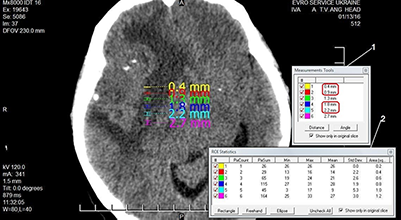
Кількість Пікселі (мм) Площа (мм2) розмір (програма) розмір (розрахунок) розмір (програма) розмір (розрахунок) 1 0,4 0,4 0,2 0,16 2 0,9 0,8 0,4 0,32 3 1,3 1,2 0,6 0,48 4 1,8 1,6 0,8 0,64 5 2,2 2,0 1,0 0,8 6 2,7 2,4 1,2 0,96Таблиця 2. Розміри пікселя та його похідних у пацієнтки Ів. ↓
На рисунку 3 наведено результати вимірювання інструментами програми eFilm значень оптичної щільності чорного фону вздовж променя від краю зображення поперечного зрізу головного мозку пацієнтки К.
Розрахункові дані внесено до таблиці 3.
Рис. 3. Значення оптичної щільності чорного фону, виміряні вздовж променя на поперечному зрізі РКТ: 1 – оптична щільність, площа пікселів; 2 – відстань від краю пікселя до видимого краю зображення зрізу; 3 – розташування пікселів в області «еталонного нуля» РКТ-зрізу; 4 – піксель зі щільністю –834 HU на відстані 18,1 мм від краю зрізу; 5 – піксель зі щільністю –1000 HU на відстані 2,9 мм від краю зрізу ↓
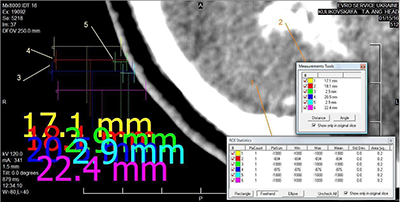
Ділянки Щільність (HU) % відповідності Відстань (мм) Різниця відстані (разів) 1 -1000 - 17,1 - По променю 2 -834 83,4 18,1 6,24 3 -1000 2,9 По променю 4 -876 87,6 20,5 7,07 5 -1000 2,9 6 -1000 - 22,4 -Таблиця 3. Значення оптичної щільності різних ділянок чорного фону вздовж променя на зрізі РКТ ↓
На рисунку 4 а, б, в наведено результати визначення поглинутих доз та оптичної щільності програмою планувальної системи на різних відстанях від зовнішнього контура.
Результати вимірювання поглинутої дози поза межами зовнішнього контура поперечного зрізу наведено в таблиці 4.
Рис. 4. Ізодозні криві поглинутої дози поза зовнішніми межами поперечного зрізу пацієнтки: а – зображено зовнішній контур зрізу поля опромінення, ізодозні криві поглинутих доз поза межами контура тіла людини; виділено точку на відстані 4 мм зі значенням поглинутої дози 5,9 Гр та оптичною щільністю -1001 HU; б – та сама ділянка, збільшене зображення, відстань від зовнішнього контура 3 мм зі значенням поглинутої дози 16 Гр та оптичною щільністю -979 HU; в – на відстані 11,4 мм від зовнішнього контура зрізу поглинута доза становить 1,5 Гр ↓
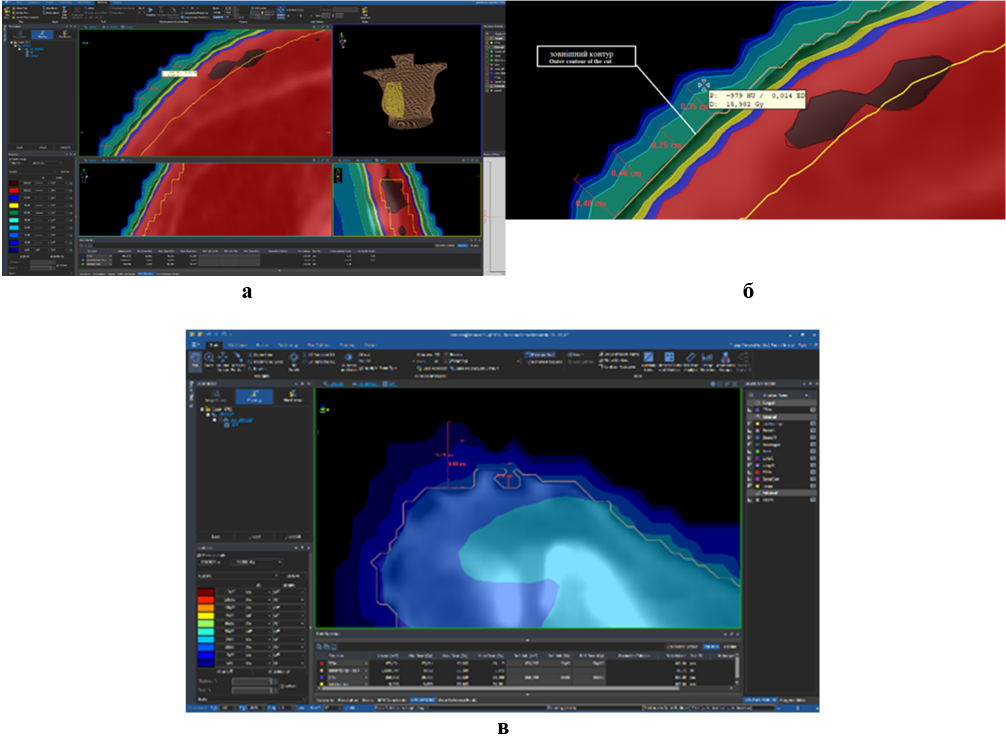
Номер заміру Відстань від зовнішнього контура поперечного зрізу (мм) Оптична цільність (HU) Поглинута доза (Гр) 1 4,0 –1001 5,9 2 3,5 –999 8,6 3 3,0 –979 16 4 1,5 –535 28Таблиця 4. Результати вимірювання поглинутої дози поза межами зовнішнього контура поперечного зрізу ↓
Наступні зображення (рис. 5 а, б) демонструють різні значення поглинутої дози в чорному фоні поза межами зрізу за однакових значень оптичної щільності.
На рисунку 6 наведено зображення поперечного зрізу пацієнта з раком носоглотки.
Рис. 5. Визначення програмою планувальної системи прискорювача електронів поглинутих доз поза зовнішнім контуром поперечного зрізу: а – оптична щільність чорного фону -992 HU, поглинута доза – 0,0 Гр; б – оптична щільність чорного фону -992 HU, поглинута доза – 15,4 Гр (той самий зріз) ↓
Рис. 6. Поглинута доза в повітрі порожнини основної пазухи. Розміри порожнини – 3,05×2,3 см. Оптична щільність -994 HU. Поглинута доза в повітрі порожнини – 56,2 Гр ↓
Сьогодні в плануванні променевої терапії засоби обробки та аналізу інформації на основі DICOM-файлів використовуються понад 30 років і стали міжнародним стандартом медичного зображення [28, 29]. МАГАТЕ (2021) наголосила на застосуванні DICOM-файлів на всіх етапах променевої терапії – діагностиці, дозиметрії, плануванні та реалізації лікування [45, 31].
Раніше нами були наведені результати щодо невизначеностей у рівномірності опромінення тканин за рахунок значущої розбіжності значень оптичної щільності суміжних пікселів та вокселів [30]. Аналіз даних вимірювання розміру пікселів та їхніх похідних у пацієнтки К. (рис. 1, табл. 1) показав таке.
Програмою визначено довжину сторони одного пікселя – 0,5 мм. До четвертого пікселя включно розмір відрізка залишався коректним, але між четвертим та п’ятим пікселем відстань мала бути 2,5 мм, тоді як фактично вона дорівнювала 2,4 мм. Виявлено також розбіжності між результатами визначення площі пікселя програмою (зображення 2, рис. 1) та ручним розрахунком. Програма показала площу 0,2 мм2, але з урахуванням розміру сторони пікселя (зображення 1, рис. 1) площа мала б становити 0,25 мм2. Для ділянок з двох та чотирьох пікселів площа, визначена програмою, збігалася з ручними розрахунками. Для ділянки з трьох пікселів відмінність становила 7,1%, з п’яти – 4,2%, з шести – 7,1%. Цілком можливо, що при збільшенні розмірів ділянки похибка виявить системність характеру, але точність планування променевої терапії ґрунтується на характеристиках вокселя, який складається з окремих пікселів, тому будь-які похибки в DICOM-файлах, що вважаються «золотим стандартом» якості медичного зображення, – неприпустимі.
В іншої пацієнтки (рис. 2, табл. 2) отримано інші результати, але теж з відмінностями. Як видно з даних, наведених у таблицях, в обох випадках спостерігається некоректне визначення програмою «eFilm» розмірів пікселя, довжини виділеної ділянки зображення та її площі, значення яких перевіряли ручними арифметичними розрахунками.
Так, у першому випадку на зрізі пацієнтки К. розмір пікселя становив 0,5 см, однак розмір відрізка з шести пікселів зменшився між четвертим та п’ятим пікселем (2,0 мм-2,4 мм), тобто замість 0,5 мм становив 0,4 мм, після чого знову дорівнював 0,5 мм (2,4 мм-2,9 мм). При аналізі програмного розрахунку площі виявилася певна закономірність. Площа з першого по другий піксель змінилася на 0,3 мм2, з другого по третій – на 0,2 мм2 , з третього по четвертий – знов на 0,3 мм2, з четвертого по п’ятий – на 0,2 мм2, з п’ятого по шостий – знов на 0,2 мм2, порушивши попередню послідовність. Можливо, при збільшенні кількості вимірювань та розрахунків закономірність виявилася би більш чіткою, але на цьому етапі її слід вважати відсутньою, а похибку програми – випадковою [14].
У пацієнтки Ів. аналіз даних, наведених у таблиці 2, виявив системну похибку 10% щодо площі зображення пікселів та 11% – щодо розмірів пікселів. При цьому фізичні умови томографії обох хворих були однаковими. Загалом проведений непараметричний аналіз програмних та розрахункових даних щодо геометричних невизначеностей виявив похибку 8-15% (статистична значущість визначалася за порогом p<0,025) залежно від того, яка ділянка розглядається – у центрі чи на периферії.
Слід зазначити, що в самому стандарті DICOM (https://www.dicomstandard.org/current) наведено перелік можливих причин порушень при відтворенні зображень. Найбільш схильними до геометричних спотворень є зображення, отримані МРТ (магнітно-резонансна томографія). У центрі поля зору (isocenter) типове середнє спотворення становить близько 0,4-0,8 мм, на периферії (на відстані 200 мм від центру) спотворення може зростати до 2-5 мм і більше. Для стереотаксичної радіохірургії критично важлива точність – похибка понад 1 мм для малих цілей (менше 20 мм) може вважатися клінічно неприйнятною (втрата якості/точності понад 5% в індексах планування). КТ (комп'ютерна томографія) та рентгенографія мають набагато менші геометричні спотворення, ніж МРТ, за винятком ефектів проекції (наприклад, видовження або вкорочення кісток на звичайному рентгенівському знімку через кут зйомки). При КТ спотворення можуть спричиняти різницю в розрахунках об'єму певних структур мозку (наприклад, кори) до 5,5% при порівнянні скоригованих і нескоригованих зображень. Відносне спотворення може бути від менше ніж 1% (у добре каліброваних системах КТ або в центрі поля зору МРТ) до понад 10-20% відносного відхилення розміру на периферії зображення. Це не просто «втрата якості» в загальному розумінні, а критична втрата геометричної точності (зміна розмірів пікселів/вокселів), що впливає на клінічну достовірність зображення [46].
Таким чином, у проведеному дослідженні спостерігали зміну розміру пікселів/вокселів в отриманих зображеннях – неточність, яка вже закладена в самому стандарті та може призвести до дуже серйозних наслідків при плануванні лікування.
Особливу увагу слід звернути на значення оптичної щільності поза зовнішніми контурами зображення об’єкта (чорний фон). Аналіз даних (рис. 3 та табл. 3) показав, що оптична щільність поза зображенням досліджуваної області («чорний фон», «нуль пікселів зображення») у першій парі по променю (2, 3) на відстані 18,1 мм дорівнює -834 HU, а на відстані 2,9 мм вона становить -1000 HU, тобто менша оптична щільність чорного фону знаходиться в 6,24 раза ближче до краю зображення поперечного зрізу черепа, ніж оптична щільність -834 HU, що суперечить очікуваній закономірності. У другій парі (4, 5) ця відстань ще більша – 7,07 раза.
Отже, оптична щільність чорного фону змінюється по променю від -1000 HU поблизу межі об'єкта, що досліджується, до -834 HU на відстані в 7 разів далі. Наявність ділянок різнорідної щільності поза зображенням зрізу, на тлі «абсолютного нуля», не виключає можливість аналогічних артефактів і на головному об'єкті – зображенні поперечного зрізу пацієнта. Це може негативно впливати на оцінку результатів лікування, а також на формування плану подальшої терапії, якщо в основу будуть покладені некоректні дані, оскільки дози для фотонної променевої терапії безпосередньо пов'язані зі значеннями Хаунсфілда (HU), отриманими з комп'ютерної томографії [47].
При аналізі результатів поглинутих доз та оптичної щільності, які визначила програма планувальної системи (рис. 4 а, б, в, табл. 4), можна констатувати, що на відстані 4 мм від зовнішнього контура поперечного зрізу при оптичній щільності зображення -1001 HU поглинута доза дорівнює 5,9 Гр. При зменшення відстані – доза зростає. Але зовнішній контур зображення поперечного зрізу, який окреслює лікар, є межею, де дія програми мала б припинитися. Разом з тим цього не відбувається і програма продовжує формувати план майбутнього опромінення. Отже аналогічні дії програми можуть відбуватися і за межами інших контурів, критично важливих – PTV, GTV та нормальних тканин. Така невизначеність може стати причиною некоректних значень поглинутих доз в об’ємах інтересу та призвести до погіршення результатів лікування пацієнта.
Привертає увагу наявність різних значень поглинутої дози в чорному фоні поза межами зрізу з однаковим значенням оптичної щільності (рис. 5 а, б). При однаковій оптичній щільності чорного фону -992 HU, на одному поперечному зрізі поглинута доза в одному вимірюванні дорівнювала 0,0 Гр, що відповідає фізичним закономірностям поглинання енергії випромінювання, тоді як в іншому вимірюванні вона становила 15,4 Гр, що пояснити складно.
Наступний приклад стосується поглинутої дози в повітрі порожнини основної пазухи (рис. 6). Якщо попередні результати складно пояснити, але вони не впливали на опромінення тканин хворого, бо знаходилися поза межами зовнішнього контура зрізу, то в цьому випадку виміряна поглинута доза в повітрі порожнини основної пазухи знаходиться всередині поперечного зрізу, поряд з пухлиною та критичними тканинами. Невизначеність полягає у великій поглинутій дозі – 56,2 Гр, яку визначає програма планувальної системи в повітряній порожнині основної пазухи. При цьому розміри порожнини досить великі, 3,05×2,3 см, а оптична щільність -994 HU.
Дослідження периферичних доз у пацієнтів є важливою задачею, оскільки буде вплив на сусідні органи та тканини, що знаходяться в зоні ризику. Слід зазначити, що під час лікування з використанням іонізуючого випромінення має вплив розсіювання, яке виникає як від компонентів прискорювача (утворюючи клінічно неприйнятну півтінь), так і від самого пацієнта. Це може сприяти збільшенню дози опромінення в тканинах за межами області лікування [48].
Резюмуючи, слід зазначити, що нами здійснено спробу визначити чинники, які можуть впливати на точність планування променевої терапії онкологічних хворих з використанням наведеної технології та відповідних засобів. Розбіжність між принципом недопущення перевищення толерантної дози для нормальних тканин і високою частотою променевих ушкоджень у більшості пацієнтів у світі може бути зменшена шляхом виявлення та усунення невизначеностей на будь-якому етапі радіаційної технології лікування. У перспективі планується системне дослідження невизначеностей у різних планувальних системах, проведення калібрування HU, аналіз впливу розміру вокселя та геометричних похибок на дозиметричні параметри, а також оцінювання потенціалу застосування штучного інтелекту для підвищення точності планування.
ВИСНОВКИ
1. Проведений аналіз показав, що програма формування зображень у форматі DICOM та програмне забезпечення планування променевої терапії на електронному прискорювачі можуть давати результати з різними видами похибок. Ці похибки зумовлюють невизначеності у визначенні поглинутих доз, що потенційно може призвести до зниження ефективності лікування онкологічних хворих.
2. Ймовірним шляхом зменшення похибок може бути удосконалення програмного забезпечення для обробки та аналізу DICOM-файлів рентген-комп’ютерної томографії, а також програмного забезпечення планувальних систем променевої терапії. Інтеграція технологій штучного інтелекту в процес планування променевої терапії відкриває нові можливості для підвищення ефективності та стандартизації, однак водночас формує нові джерела невизначеності, що потребують ретельного контролю якості та експертної оцінки.
Внески авторів:
Кіхтенко І.М. – концептуалізація, методологія, написання – початковий проєкт;
Хворостенко Ю.М. – дослідження, ресурси, курація даних, візуалізація;
Філоненко Н.Ю. – методологія, формальний аналіз, написання – рецензування та редагування;
Галдіна О.М. – формальний аналіз, написання – рецензування та редагування.
Фінансування. Дослідження не має зовнішніх джерел фінансування.
Конфлікт інтересів. Автори заявляють про відсутність конфлікту інтересів.
REFERENCES
1. World Health Organization. Global cancer burden growing amidst mounting need for services [Internet]. 2024 [cited 2025 Dec 12]. Available from: https://www.who.int/news/item/01-02-2024-global-cancer-burden-growing--amidst-mounting-need-for-services
2. Siegel RL, Kratzer TB, Giaquinto AN, Sung H, Jemal A. Cancer statistics, 2025. CA Cancer J Clin. 2025;75(1):10-45. doi: https://doi.org/10.3322/caac.21871
3. Liu B, Zhou H, Tan L, Siu KTH, Guan XY. Exploring treatment options in cancer: tumor treatment strategies. Signal Transduct Target Ther. 2024;9:175. doi: https://doi.org/10.1038/s41392-024-01856-7
4. Fedorenko ZP, Gorokh Ye, Ryzhov A, Soumkina O. [Cancer in Ukraine, 2023-2024: Incidence, Mortality, and Performance Indicators of the Oncology Service]. Bull Natl Cancer Regist Ukr. Vol. 26. [Internet]. Kyiv; 2025 [cited 2025 Dec 12]. Ukrainian. Available from: http://www.ncru.inf.ua/publications/BULL_26/PDF_E/0-titul.pdf
5. Zafar A, Khatoon S, Khan MJ, Abu J, Naeem A. Advancements and limitations in traditional anti-cancer therapies: a comprehensive review. Discov Onc. 2025;16:607. doi: https://doi.org/10.1007/s12672-025-02198-8
6. Desai I, Thakur S, Pagariya P. Current advances in immunotherapy for cancer. Oral Oncol Rep. 2024;12:100652. doi: https://doi.org/10.1016/j.oor.2024.100652
7. Portik D, Lacombe D, Faivre-Finn C, Achard V, Andratschke N, Correia D, et al. The 2024 State of Science report from the the European Organisation for Research and Treatment of Cancer’s Radiation Oncology Scientific Council. Eur J Cancer. 2025;220:115334. doi: https://doi.org/10.1016/j.ejca.2025.115334
8. World Health Organization/IAEA. New WHO/IAEA publication provides guidance on radiotherapy equipment to fight cancer [Internet]. 2021 [cited 2025 Dec 12]. Available from: https://www.who.int/news/item/05-03-2021-new-who-iaea-publication-provides-guidance-on-radiotherapy-equipment-to-fight-cancer
9. Majeed H, Gupta V. Adverse effects of radiation therapy. In: StatPearls [Internet]. Treasure Island (FL): StatPearls Publishing; 2025 Jan [cited 2025 Dec 12]. Available from: https://www.ncbi.nlm.nih.gov/books/NBK563259/
10. Catalano O, Fusco R, Carriero S, Tamburrini S, Granata V. Ultrasound findings after breast cancer radiation therapy. Korean J Radiol. 2024;25(11):982-91. doi: https://doi.org/10.3348/kjr.2024.0672
11. Moisander M, Skyttä T, Kivistö S, et al. Radiotherapy-induced diffuse myocardial fibrosis in early-stage breast cancer patients. Radiat Oncol. 2023;18(1):124. doi: https://doi.org/10.1186/s13014-023-02319-z
12. Singh P, Mishra A, Mishra SK. Challenges and potential side effects of radiation therapy for palliative cancer treatment. Med Palliative. 2024;23(2):75-91. doi: https://doi.org/10.1016/j.medpal.2023.12.002
13. Ohno T, Kamiguchi A, Honda M, Shimohigashi Y, Kuraoka A, Toyota M, et al. Enhancing patient positioning precision: a comparative analysis of surface-guided radiation therapy systems. Radiol Phys Technol. 2025 Sep;18(3):833-50. doi: https://doi.org/10.1007/s12194-025-00937-8
14. International Atomic Energy Agency. Accuracy requirements and uncertainties in radiotherapy. [Internet]. Vienna: International Atomic Energy Agency; 2016 [cited 2025 Dec 12]. (IAEA Human Health Series. No. 31). Available from: https://www-pub.iaea.org/MTCD/Publications/PDF/P1679_HH31_web.pdf
15. International Atomic Energy Agency. Handbook of basic quality control tests for diagnostic radiology. [Internet]. Vienna: International Atomic Energy Agency; 2023 [cited 2025 Dec 12]. (IAEA Human Health Series. No. 47). Available from: https://www-pub.iaea.org/MTCD/Publications/PDF/PUB2021_web.pdf
16. International Atomic Energy Agency. Absorbed dose determination in external beam radiotherapy. [Internet]. Vienna: International Atomic Energy Agency; 2024 [cited 2025 Dec 12]. (Technical Reports Series. No. 398 (Rev. 1)). Available from: https://www-pub.iaea.org/MTCD/Publications/PDF/TRS398_scr.pdf
17. International Atomic Energy Agency. Dosimetry in Brachytherapy – An International Code of Practice for Secondary Standards Dosimetry Laboratories and Hospitals. [Internet]. Vienna: International Atomic Energy Agency; 2023 [cited 2025 Dec 12]. (Technical Reports Series. No. 492). Available from: https://www-pub.iaea.org/MTCD/Publications/PDF/DOC-010-492_web.pdf
18. American Association of Physicists in Medicine. Physical Uncertainties in the Planning and Delivery of Light Ion Beam Treatments: The Report of AAPM Task Group 202. [Internet]. Alexandria (VA): AAPM; 2020 [cited 2025 Dec 12]. 124 p. (AAPM Report. No. 202). Available from: https://www.aapm.org/pubs/reports/RPT_202.pdf
19. Siochi RA, Balter P, Bloch CD, Santanam L, Blodgett K, Curran BH, et al. Report of Task Group 201 of the American Association of Physicists in Medicine: quality management of external beam therapy data transfer. Med Phys. 2021;48:e86-114. doi: https://doi.org/10.1002/mp.14868
20. Brock KK, Mutic S, McNutt TR, Li H, Kessler ML. Use of image registration and fusion algorithms and techniques in radiotherapy: report of the AAPM Radiation Therapy Committee Task Group No. 132. Med Phys. 2017;44:e43-76. doi: https://doi.org/10.1002/mp.12256
21. Bissonnette JP, Balter PA, Dong L, Langen KM, Lovelock DM, Miften M, et al. Quality assurance for image-guided radiation therapy utilizing CT-based technologies: a report of the AAPM TG-179. Med Phys. 2012;39:1946-63. doi: https://doi.org/10.1118/1.3690466
22. Matuszak N, Kruszyna-Mochalska M, Skrobala A, Ryczkowski A, Romanski P, Piotrowski I, et al. Nontarget and out-of-field doses from electron beam radiotherapy. Life. 2022;12(6):858. doi: https://doi.org/10.3390/life12060858
23. Maharaj KD, Dass J, Ibrahim M, Mahmood T, Rowshanfarzad P. Peripheral Doses Beyond Electron Applicators in Conventional C-Arm Linear Accelerators: A Systematic Literature Review. Technology in Cancer Research & Treatment. 2024;23:15330338241239144. doi: https://doi.org/10.1177/15330338241239144
24. Gul OV. Experimental evaluation of out-of-field dose for different high-energy electron beams and applicators used in external beam radiotherapy. Radiat Phys Chem. 2024;215:111345. doi: https://doi.org/10.1016/j.radphyschem.2023.111345
25. Maharaj KD, Sabet M, Dass J, Ibrahim M, Mahmood T, Rowshanfarzad P. Comprehensive analysis of peripheral dose in electron beam therapy with a Varian TrueBeam Linac. Radiat Med Prot. 2025;6(1):28-36. doi: https://doi.org/10.1016/j.radmp.2024.10.003
26. Maharaj KD, Dass J, Ibrahim M, Mahmood T, Rowshanfarzad P. Peripheral doses beyond electron applicators in conventional C-arm linear accelerators: a systematic literature review. Technol Cancer Res Treat. 2024;23:1-9. doi: https://doi.org/10.1177/15330338241239144
27. van den Berg CAT, Meliadò EF. Uncertainty assessment for deep learning radiotherapy applications. Semin Radiat Oncol. 2022;32(4):304-18. doi: https://doi.org/10.1016/j.semradonc.2022.06.001
28. Yang L. DICOM standard and its application in radioinformatics. Int J Comput Sci Inf Technol. 2024;2(1):384-90. doi: https://doi.org/10.62051/ijcsit.v2n1.40
29. Larobina M. Thirty years of the DICOM standard. Tomography. 2023;9:1829-38. doi: https://doi.org/10.3390/tomography9050145
30. Khvorostenko MI, Kikhtenko IM, Khvorostenko YM. [Influence of tumor tissue heterogeneity on the quality of radiotherapy planning]. [Internet]. Ukr Radiol J. 2016 [cited 2025 Dec 12];24(2):67-72. Ukrainian. Available from: https://irbis-nbuv.gov.ua/cgi-bin/irbis_nbuv/cgiirbis_64.exe?C21COM=2&I21DBN=UJRN&P21DBN=UJRN&IMAGE_FILE_DOWNLOAD=1&Image_file_name=PDF/URLZh_2016_24_2_16.pdf
31. Moeller TB, Reif E. Normal findings in CT and MRI [Internet]. Stuttgart: Thieme; 2000 [cited 2025 Dec 12]. 256 p. Available from: https://radoir.org/en/wp-content/uploads/2018/06/NFCTMRI.pdf
32. Rasmussen ME, Akbarov K, Titovich E, et al. Potential of e-learning interventions and artificial intelligence-assisted contouring skills in radiotherapy: the ELAISA study. JCO Glob Oncol. 2024;10:e2400173. doi: https://doi.org/10.1200/GO.24.00173
33. Maduro Bustos LA, Sarkar A, Doyle LA, Andreou K, Noonan J, Nurbagandova D, et al. Feasibility evaluation of novel AI-based deep-learning contouring algorithm for radiotherapy. J Appl Clin Med Phys. 2023;24(11):e14090. doi: https://doi.org/10.1002/acm2.14090
34. Hu Y, Nguyen H, Smith C, Chen T, Byrne M, Archibald-Heeren B, et al. Clinical assessment of a novel machine-learning automated contouring tool for radiotherapy planning. J Appl Clin Med Phys. 2023;24(7):e13949. doi: https://doi.org/10.1002/acm2.13949
35. D'Aviero A, Re A, Catucci F, Piccari D, Votta C, Piro D, et al. Clinical Validation of a Deep-Learning Segmentation Software in Head and Neck: An Early Analysis in a Developing Radiation Oncology Center. Int J Environ Res Public Health. 2022;19(15):9057. doi: https://doi.org/10.3390/ijerph19159057
36. Finnegan RN, Quinn A, Horsley P, Chan J, Stewart M, Bromley R, et al. Geometric and dosimetric evaluation of a commercial AI auto-contouring tool on multiple anatomical sites in CT scans. J Appl Clin Med Phys. 2025;26(6):e70067. doi: https://doi.org/10.1002/acm2.70067
37. Soltaninejad A, Shahbazi-Gahrouei D, Khorasani A, Hemati S. Evaluation of CNN-based deep learning models for auto-contouring in glioblastoma radiotherapy: a review. Radiat Oncol. 2025;20(1):169. doi: https://doi.org/10.1186/s13014-025-02748-y
38. International Atomic Energy Agency. Setting Up a Radiotherapy Programme. [Internet]. Vienna: International Atomic Energy Agency; 2008 [cited 2025 Dec 12]. Available from: https://www-pub.iaea.org/MTCD/Publications/PDF/pub1296_web.pdf
39. International Atomic Energy Agency. A Handbook for the Education of Radiation Therapists (RTTs). [Internet]. Vienna: International Atomic Energy Agency; 2014 [cited 2025 Dec 12]. (Training Course Series. No. 58). Available from:
https://www-pub.iaea.org/MTCD/Publications/PDF/TCS-58_web.pdf
40. Brown SR, Van Hemelrijck M, Price G, Oppong FB, Verhoeff JJC, Faivre-Finn C. Novel methodologies for clinical research in radiation oncology: Time to think outside of the box? A narrative review. Radiother Oncol. 2025 Dec 9:111311. doi: https://doi.org/10.1016/j.radonc.2025.111311
41. Green H, Rieu R, Slevin F, Ashmore L, Bulbeck H, Gkogkou P, et al. CTRad Working Group 4. Best practice for patient-centred radiotherapy in clinical trials and beyond: A national multidisciplinary consensus. Clin Oncol (R Coll Radiol). 2025;39:103732. doi: https://doi.org/10.1016/j.clon.2024.103732
42. Schaue D, McBride WH. Opportunities and challenges of radiotherapy for treating cancer. Nat Rev Clin Oncol. 2015 Sep;12(9):527-40. doi: https://doi.org/10.1038/nrclinonc.2015.120
43. Schober P, Vetter TR. Nonparametric Statistical Methods in Medical Research. Anesth Analg. 2020;131(6):1862-3. doi: https://doi.org/10.1213/ANE.0000000000005101
44. Bonnini S, Assegie GM, Trzcinska K. Review about the Permutation Approach in Hypothesis Testing. Mathematics. 2024;12(17):2617. doi: https://doi.org/10.3390/math12172617
45. World Health Organization. Technical specifications of radiotherapy equipment for cancer treatment. [Internet]. Geneva: WHO; 2021 [cited 2025 Dec 12]. Available from: https://www.oncologysystems.com/wp-content/uploads/2021/03/2021-Handbook-on-Radiotherapy-Equipment.pdf
46. Mabizela S. Navigating parametric and non-parametric statistical analyses: a practical guide in health sciences research. Wits J Clin Med. 2025;7(1):41-4. doi: https://doi.org/10.18772/26180197.2025.v7n1a9
47. Mohan R. A review of proton therapy – Current status and future directions. Prec Radiat Oncol. 2022;6:164-76. doi: https://doi.org/10.1002/pro6.1149
48. Mendes RMS, Silva MG, Rebello WF, Oliveira CL, Stenders RM, Medeiros MPC, et al. Influence of radiotherapy room shielding on ambient dose equivalent due to photons H(10)p and neutrons H(10)n in the patient’s plane. Appl Radiat Isot. 2022;181:110095. doi: https://doi.org/10.1016/j.apradiso.2021.110095
 UK
UK  EN
EN